top of page

Planet-Level Nuggets

Climate Nuggets uses several social media platforms to get these Nuggets into the hands of constituents and policymakers. Each platform has its strengths — Facebook and Instagram are powerful for reaching your followers and spreading the word broadly. But X has a unique advantage: you can direct a post straight to your Member of Congress by name, so their office sees it — and so do all their other constituents, who can re-post it too.

That's why each Nugget below has a Send to Your Rep button — click it and our Find Your Reps tool sets up your X post in seconds, including the Nugget image. Not sure how it works, or how to get set up on X? Visit our How to Send Nuggets → page.

We're always looking for better ways to reach policymakers and build constituent pressure. Got ideas? Send them to getinvolved@climatenuggets.org — we'd love to hear from you.

G1- This Warming is Not Natural

G1
G1_hires.png

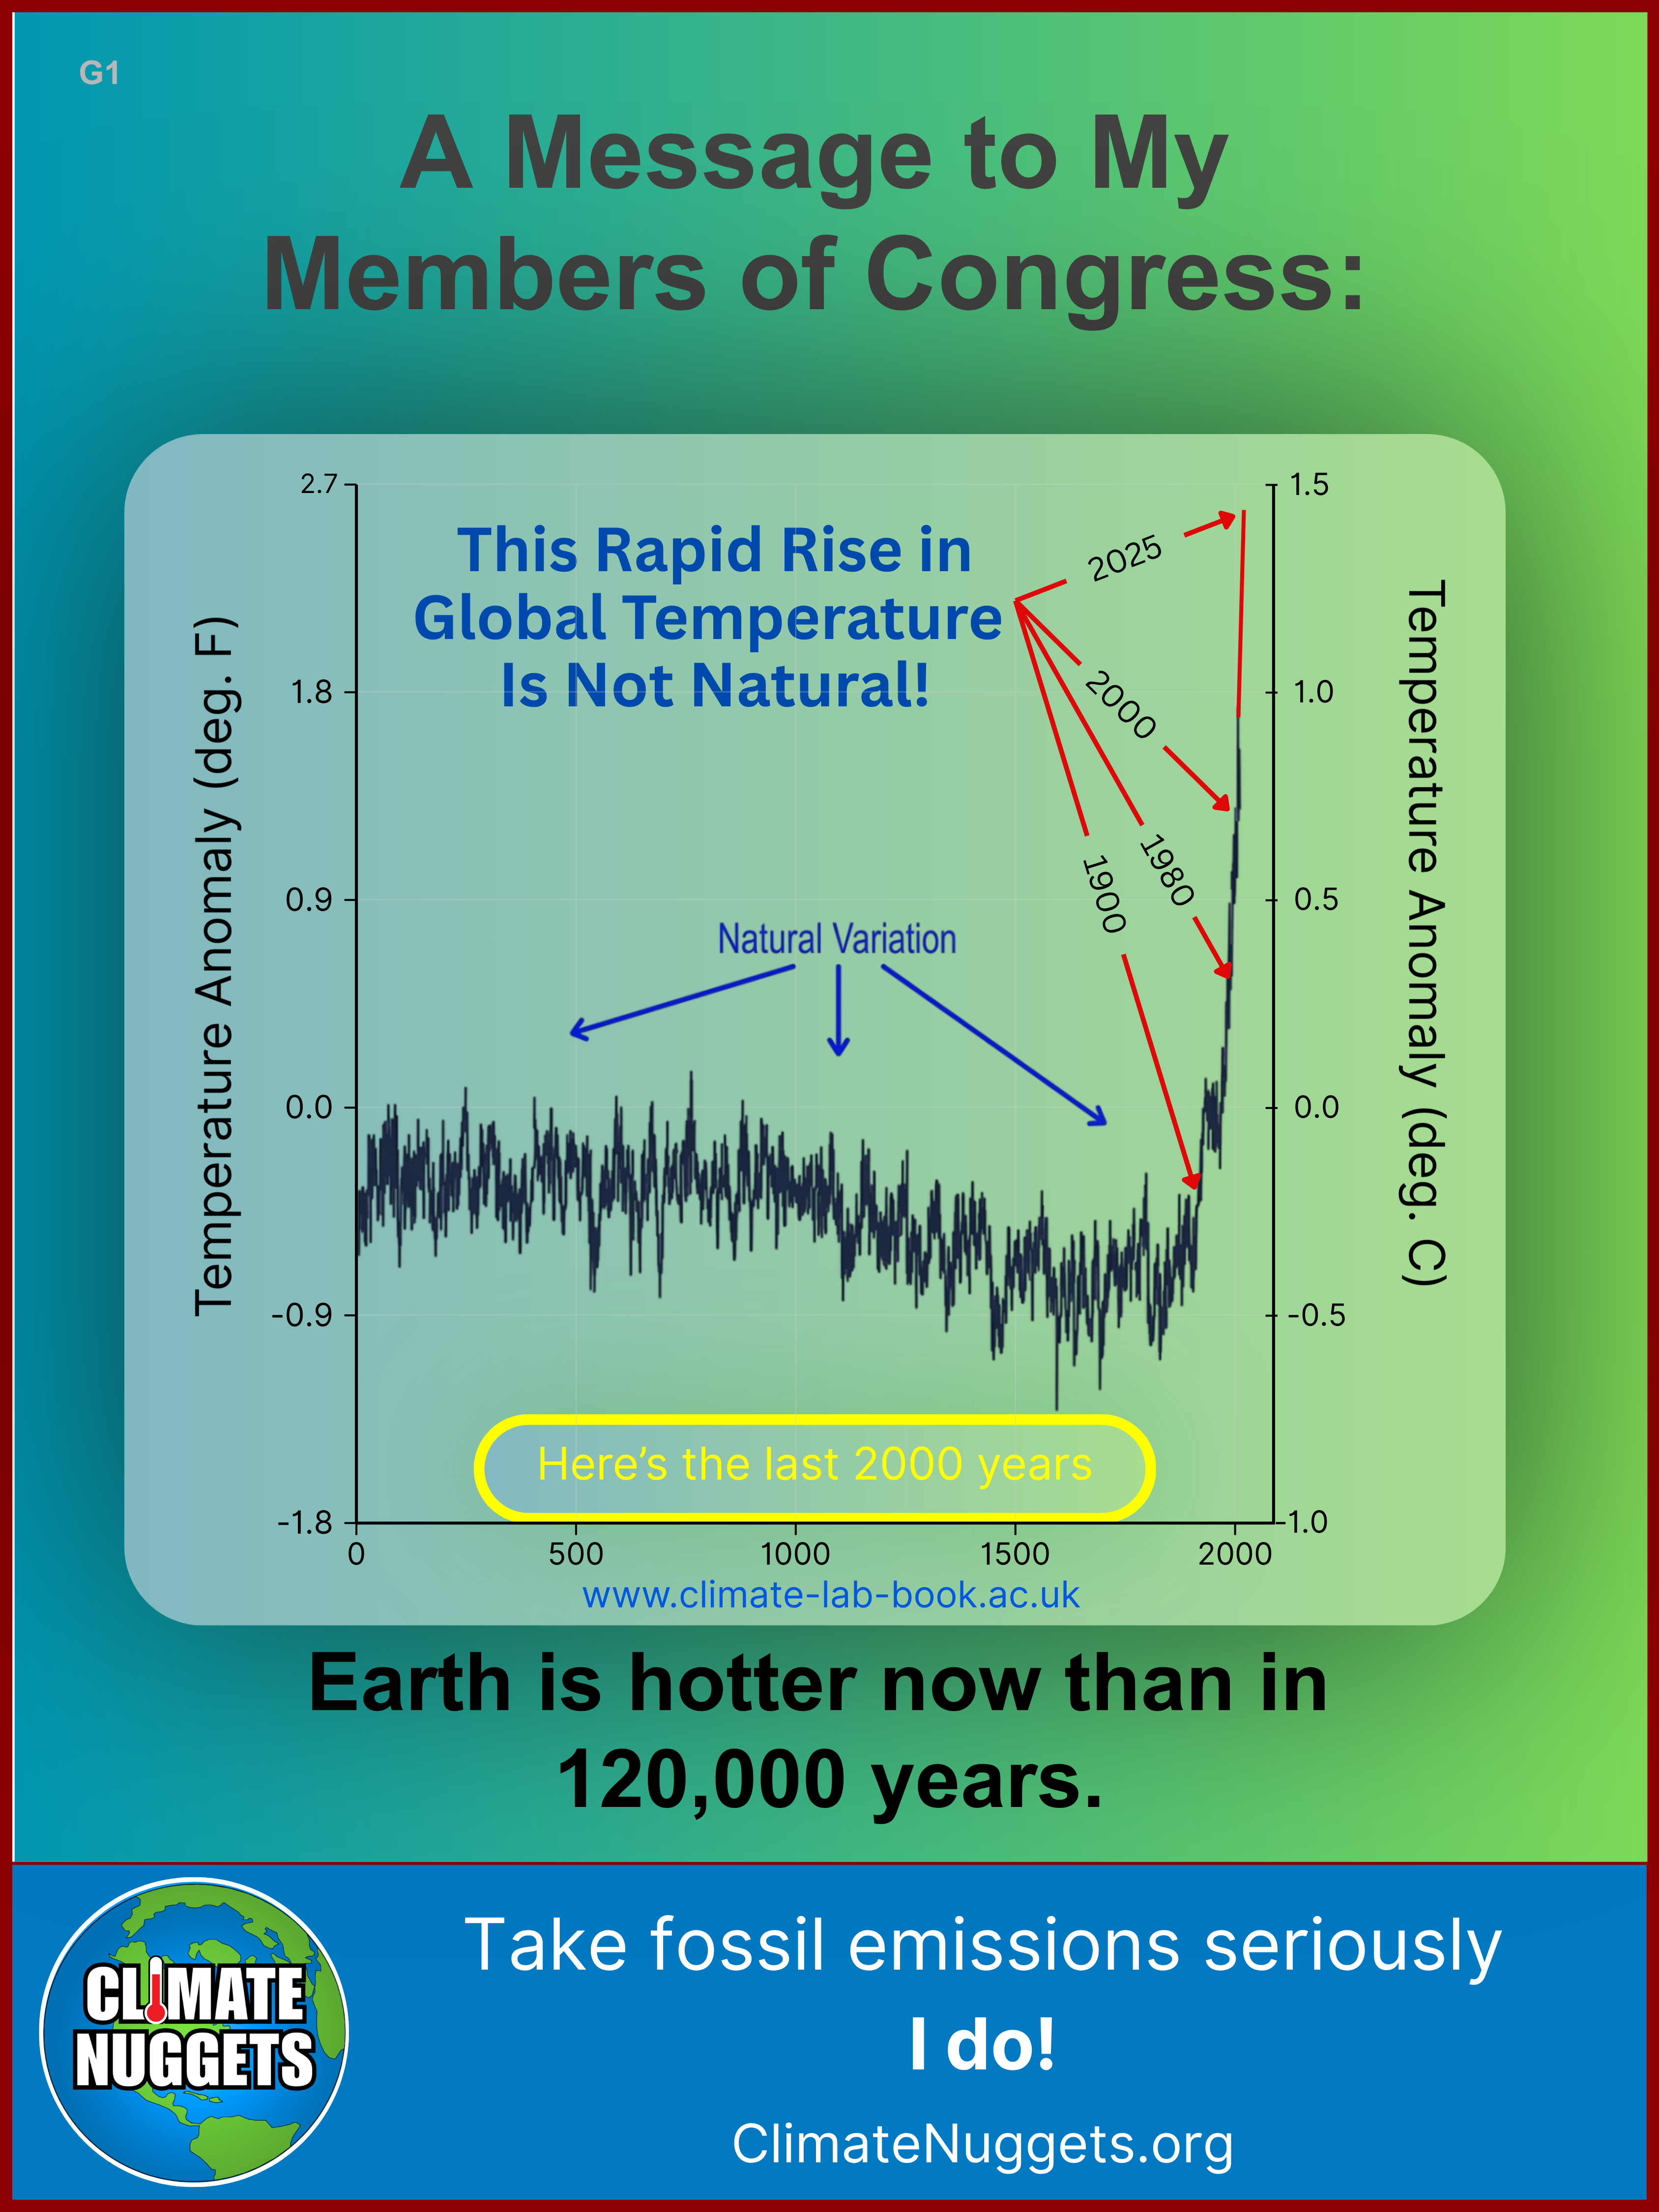
This chart shows today's temperature rise sitting completely outside 2,000 years of natural variation — proof this isn't a cycle.   And it's been 120,000 years since it's been this hot!  Send it to any rep who still treats the warming itself as up for debate.

Discussion:  The chart comes directly from Open Mind, and we've updated it to 2025.  While there are plenty of sources for global temperatures over the last 2000 years, the Wikipedia article is useful. The PBS News article gives perspective on how we can know temperatures from the far past.  An understanding of the impacts of CO2 levels being as high as they now are (>425 parts per million in the atmosphere) are well described in the Columbia University study.  The Nature article is focused primarily on the Northern Hemisphere and adds context.   The Science article is more recent and discusses the 14 million years since CO2 was this high.  The NASA: Is Current Warming Natural? article provides an excellent tutorial on how global warming and climate change is happening and is understood.  The other references can add depth to your understanding.

G2 — We Know the Cause of the Warming

G2
G2_hires.png

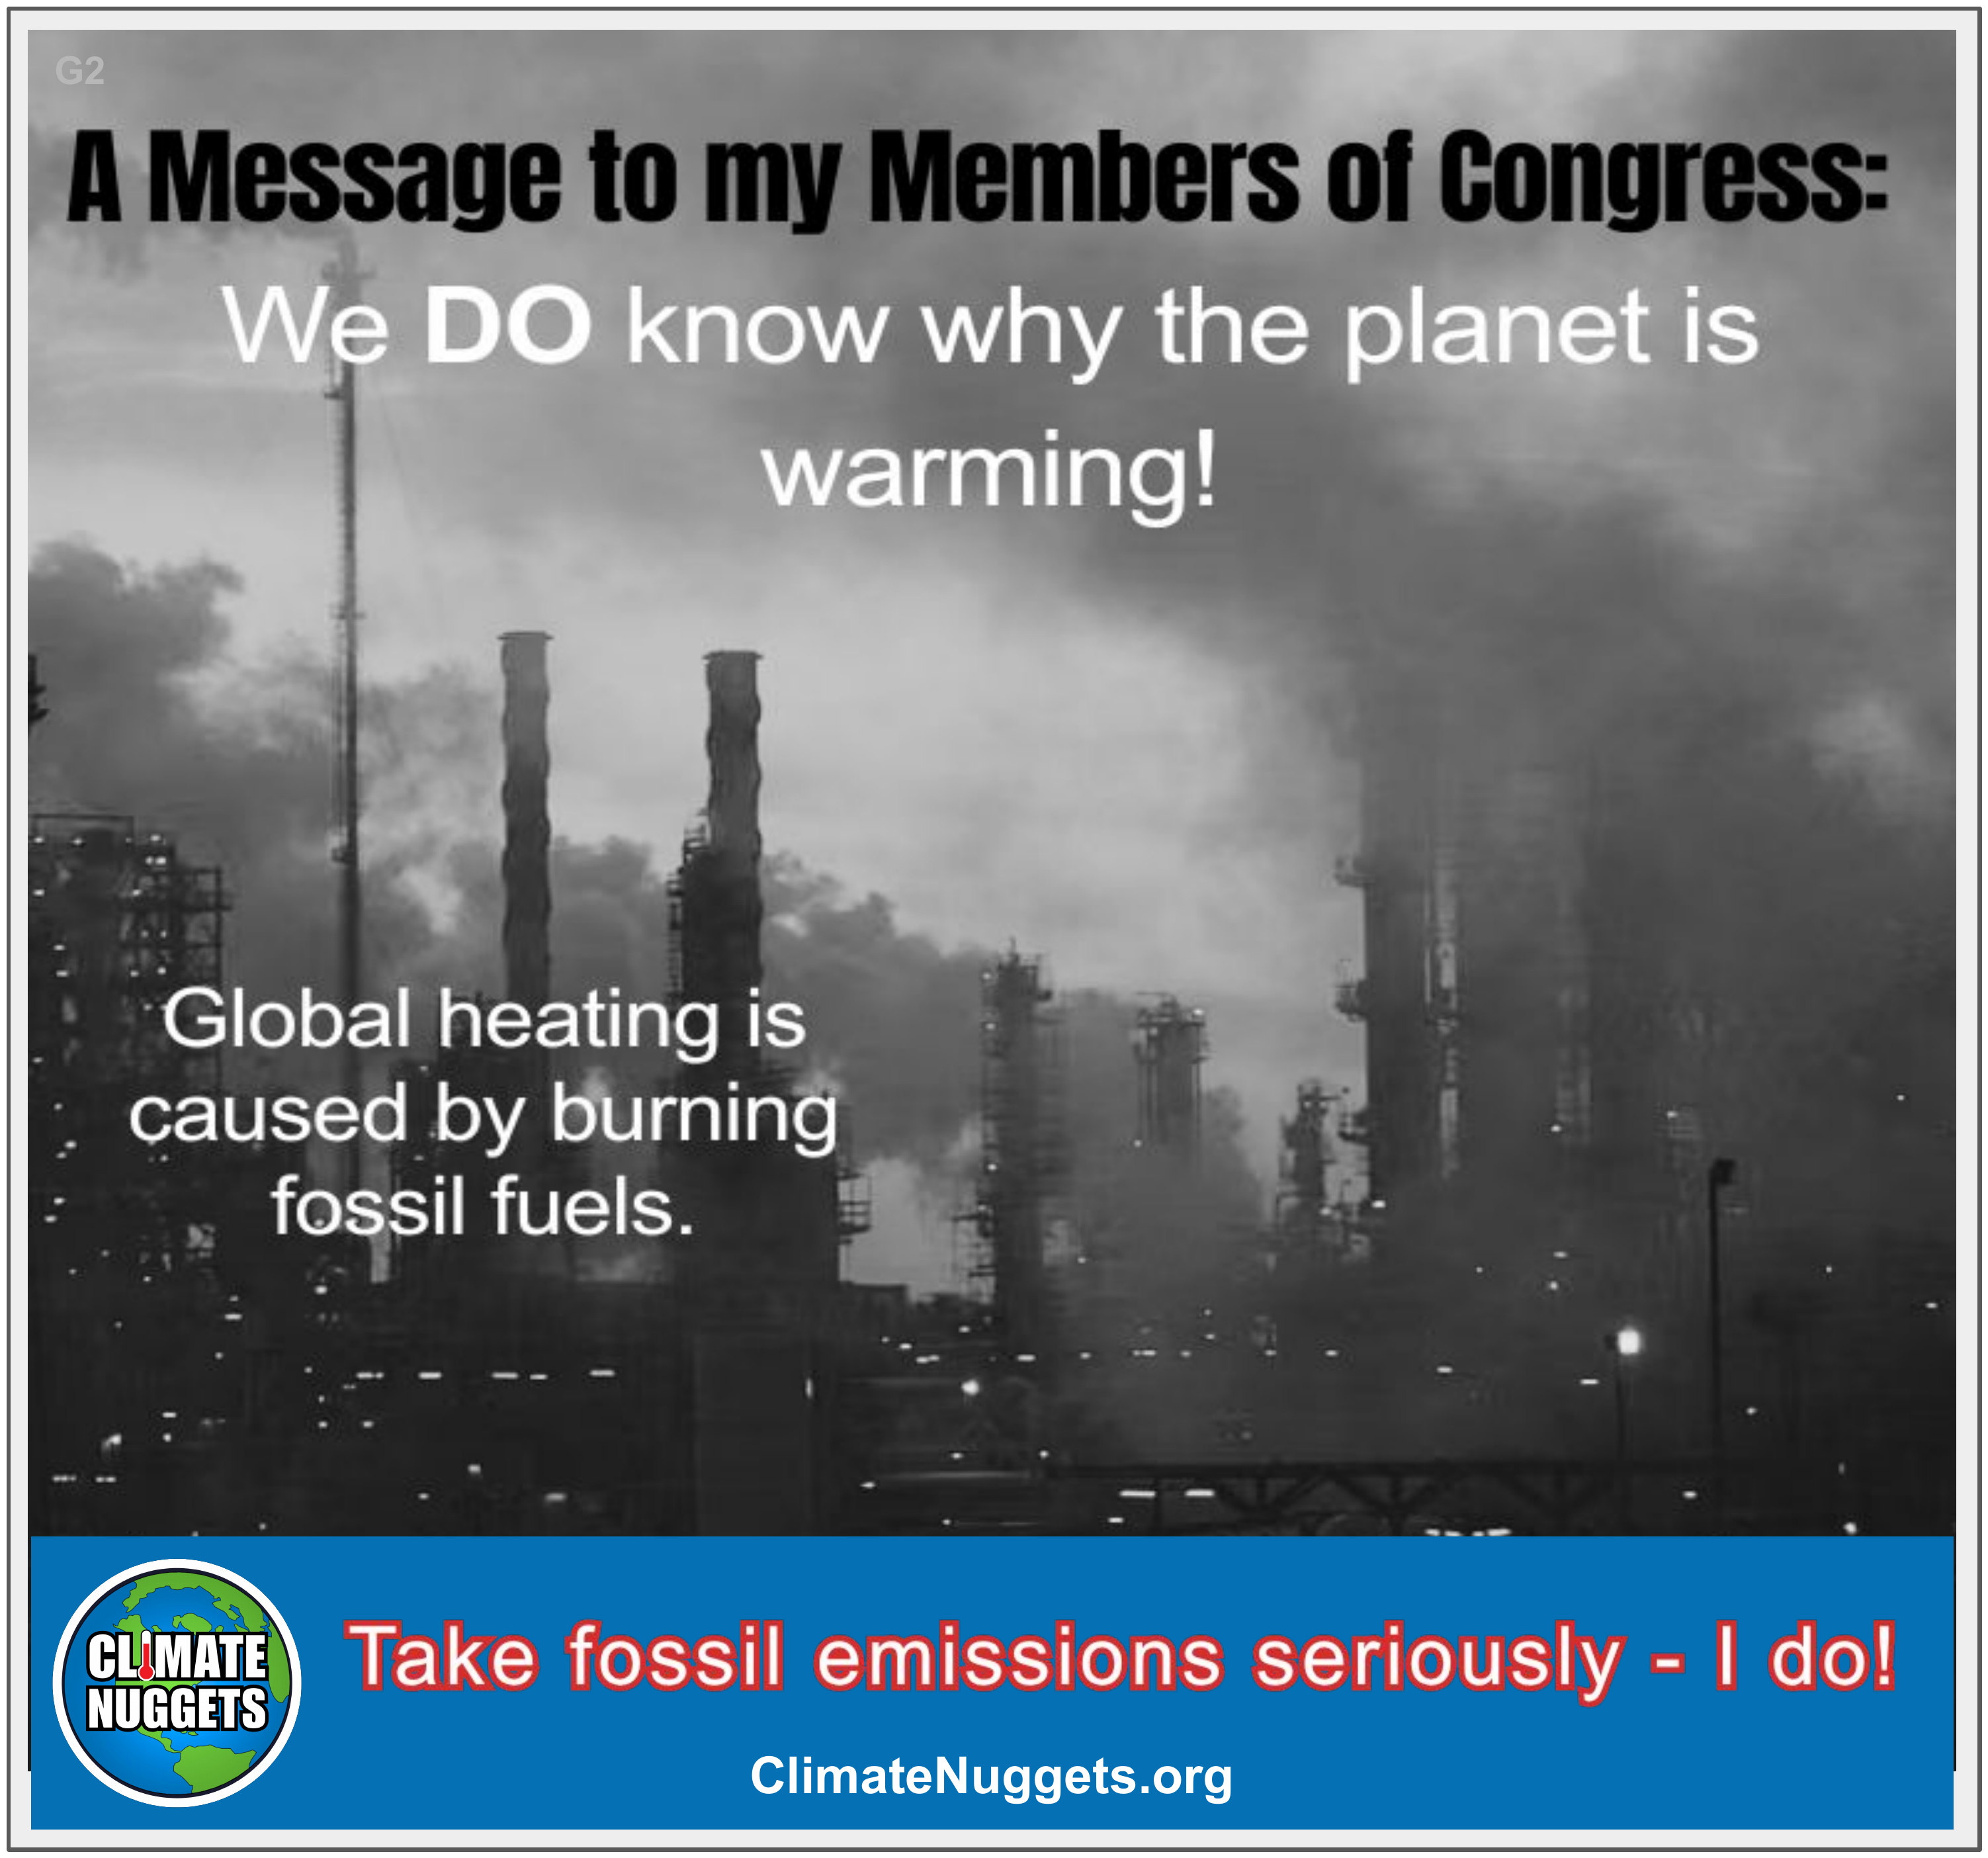
This image pins global warming's cause directly on fossil fuel emissions, leaving no room for the 'natural cycles' excuse. Send it to any rep still leaning on that line.

Explore Resources for this Nugget:


European Environment Agency:  Atmospheric greenhouse gas concentrations

Hansen:  Warning! This “Colorful Chart” is Censored by IPCC

Just Have a Think:  Our planet is warming TWICE as fast as we thought!

RealClimate:  Much ado about acceleration

Berkeley Earth:  October 2025 Temperature Update

Our World in Data:  Greenhouse gas emissions

Intergovernmental Panel of Climate Change:  Figure AR6 WG2

Hansen:  Global warming in the pipeline | Oxford Open Climate Change

Rhamstorf:  Global Warming has Accelerated Significantly (not yet peer reviewed)

G2a

G2a — Fossil Emissions Cause Global Heating

G2a_nugget_hires_v3.png

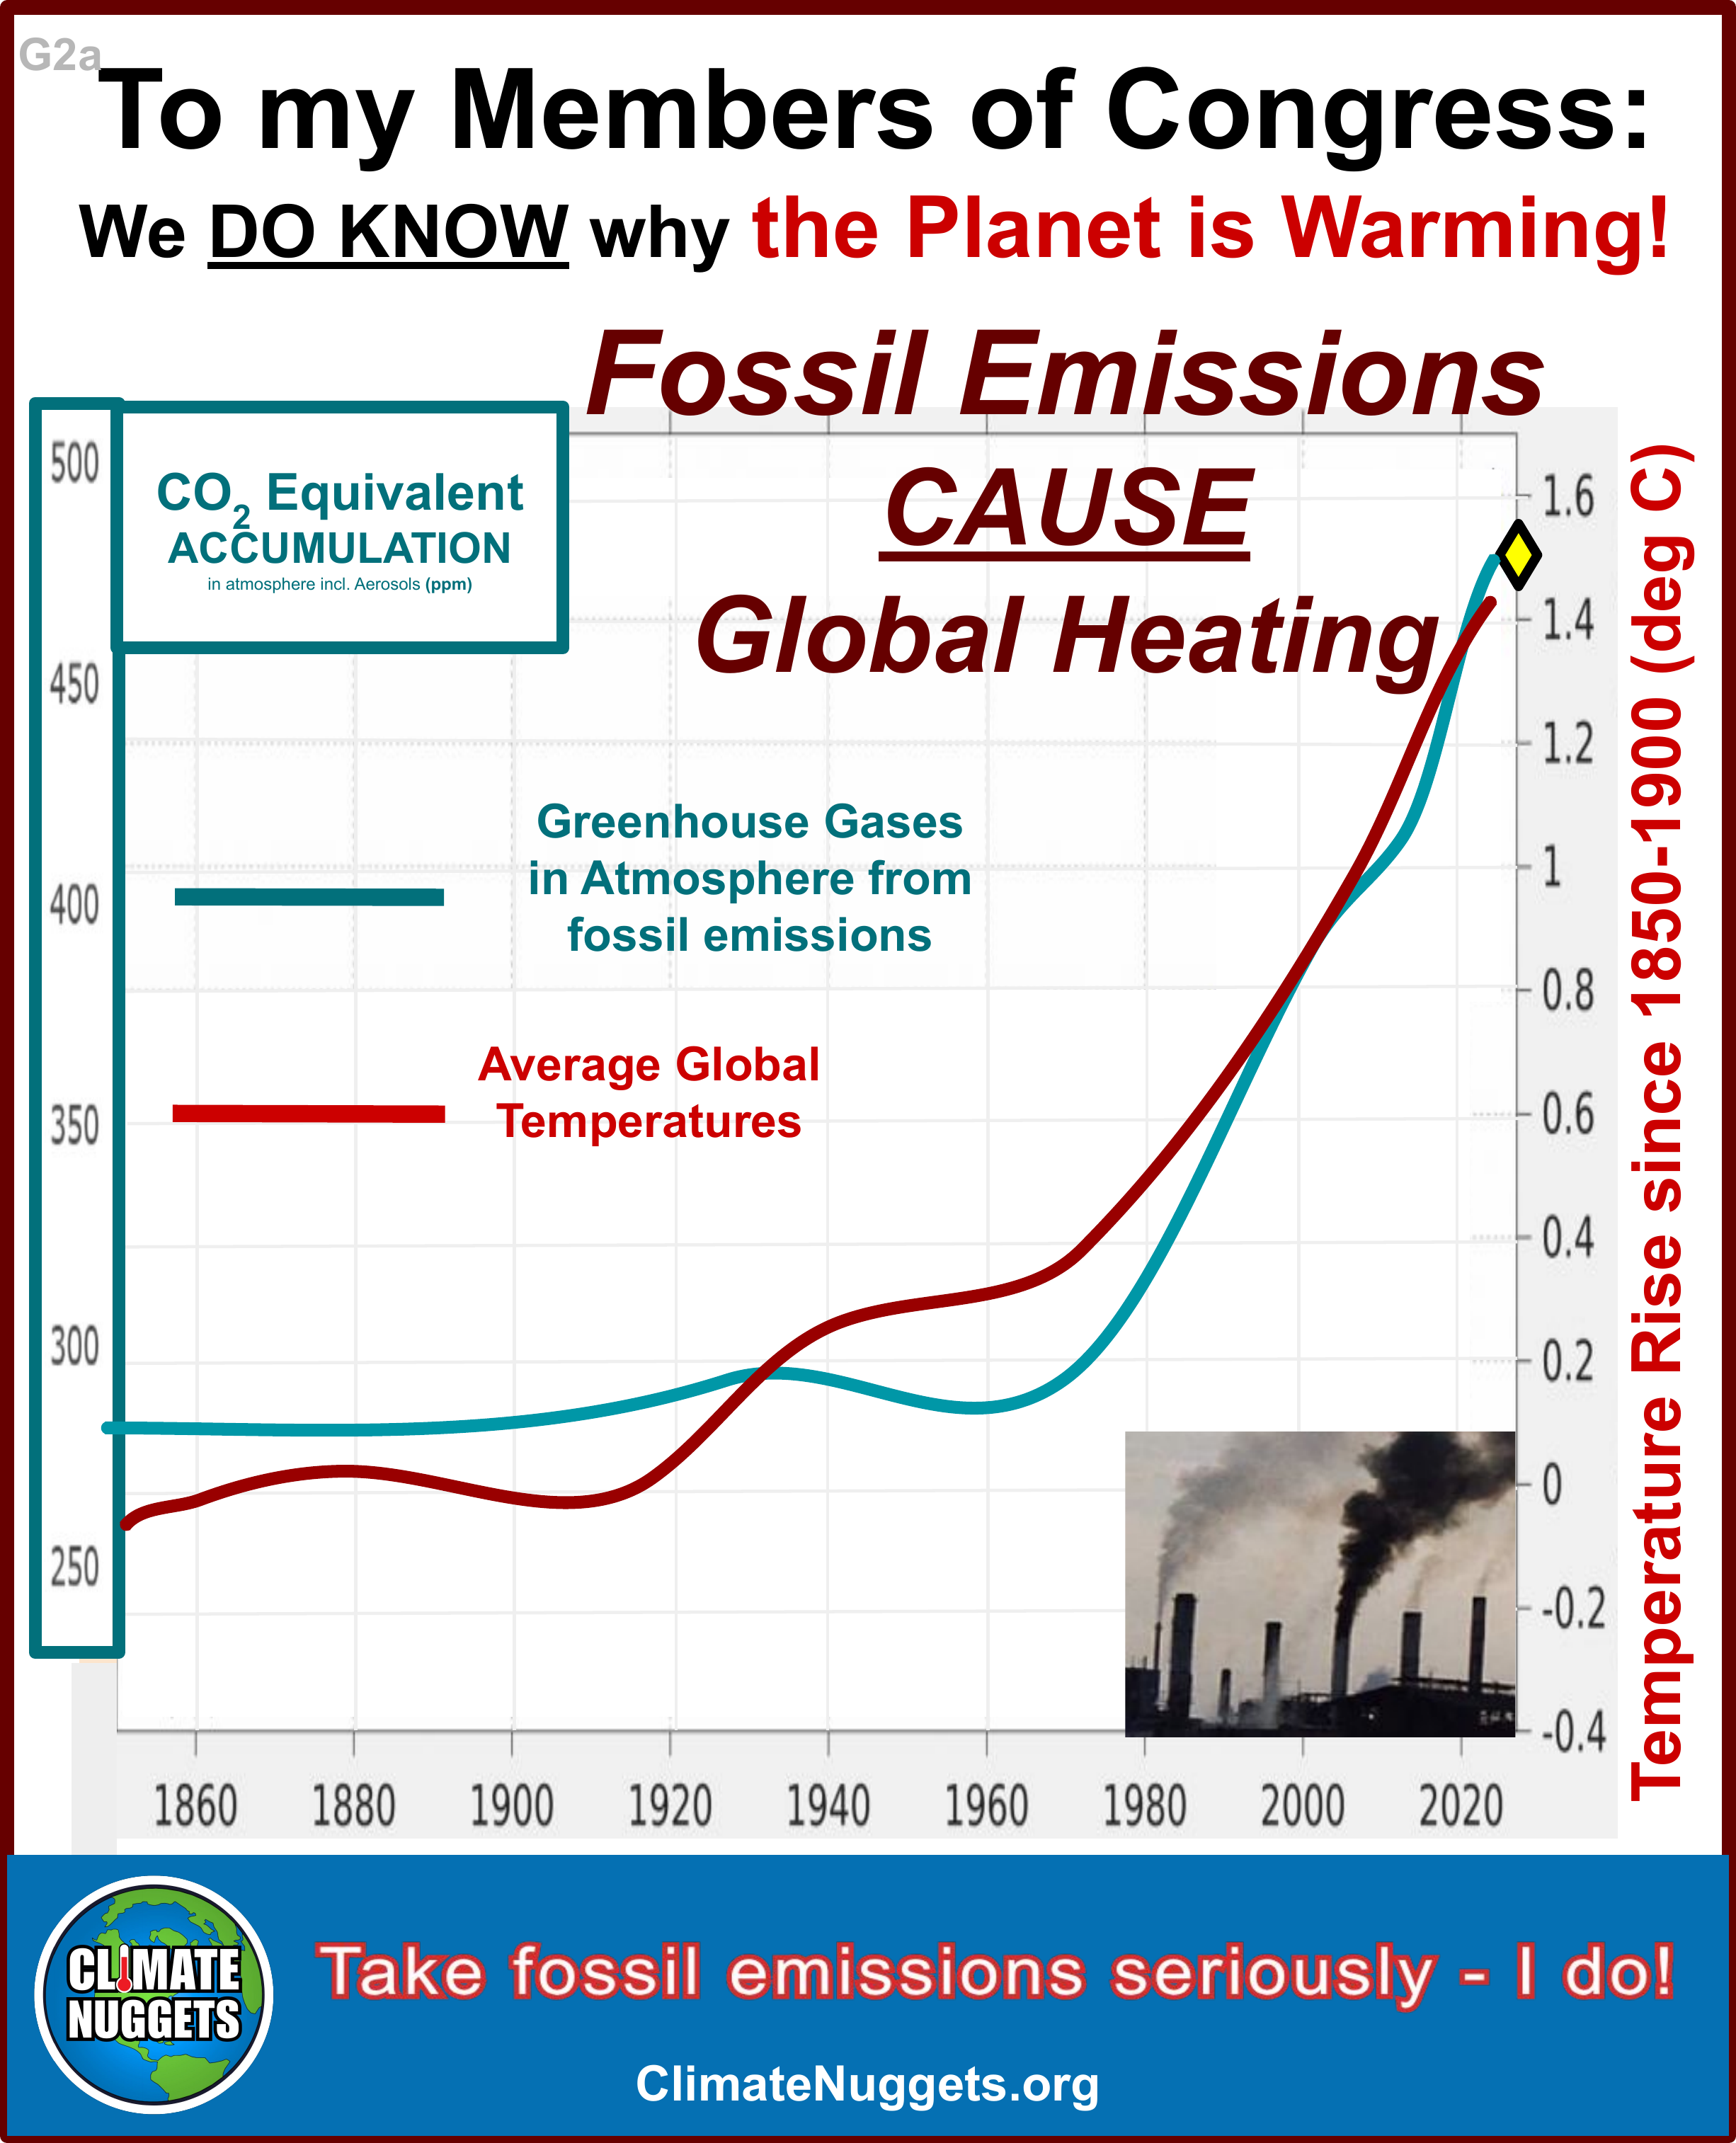
This chart is direct proof that our rising global temperatures result from burning fossil fuels, as predicted in 1896 by Svante Arrhenius. Send it to any rep who still treats the cause as up for debate

Explore Resources for this Nugget:


European Environment Agency:  Atmospheric greenhouse gas concentrations

Hansen:  Warning! This “Colorful Chart” is Censored by IPCC

Just Have a Think:  Our planet is warming TWICE as fast as we thought!

RealClimate:  Much ado about acceleration

Berkeley Earth:  October 2025 Temperature Update

Our World in Data:  Greenhouse gas emissions

Intergovernmental Panel of Climate Change:  Figure AR6 WG2

Hansen:  Global warming in the pipeline | Oxford Open Climate Change

Rhamstorf:  Global Warming has Accelerated Significantly (not yet peer reviewed)

G3 — Heating from Emissions Is Accelerating
G3
G3_repaired.png

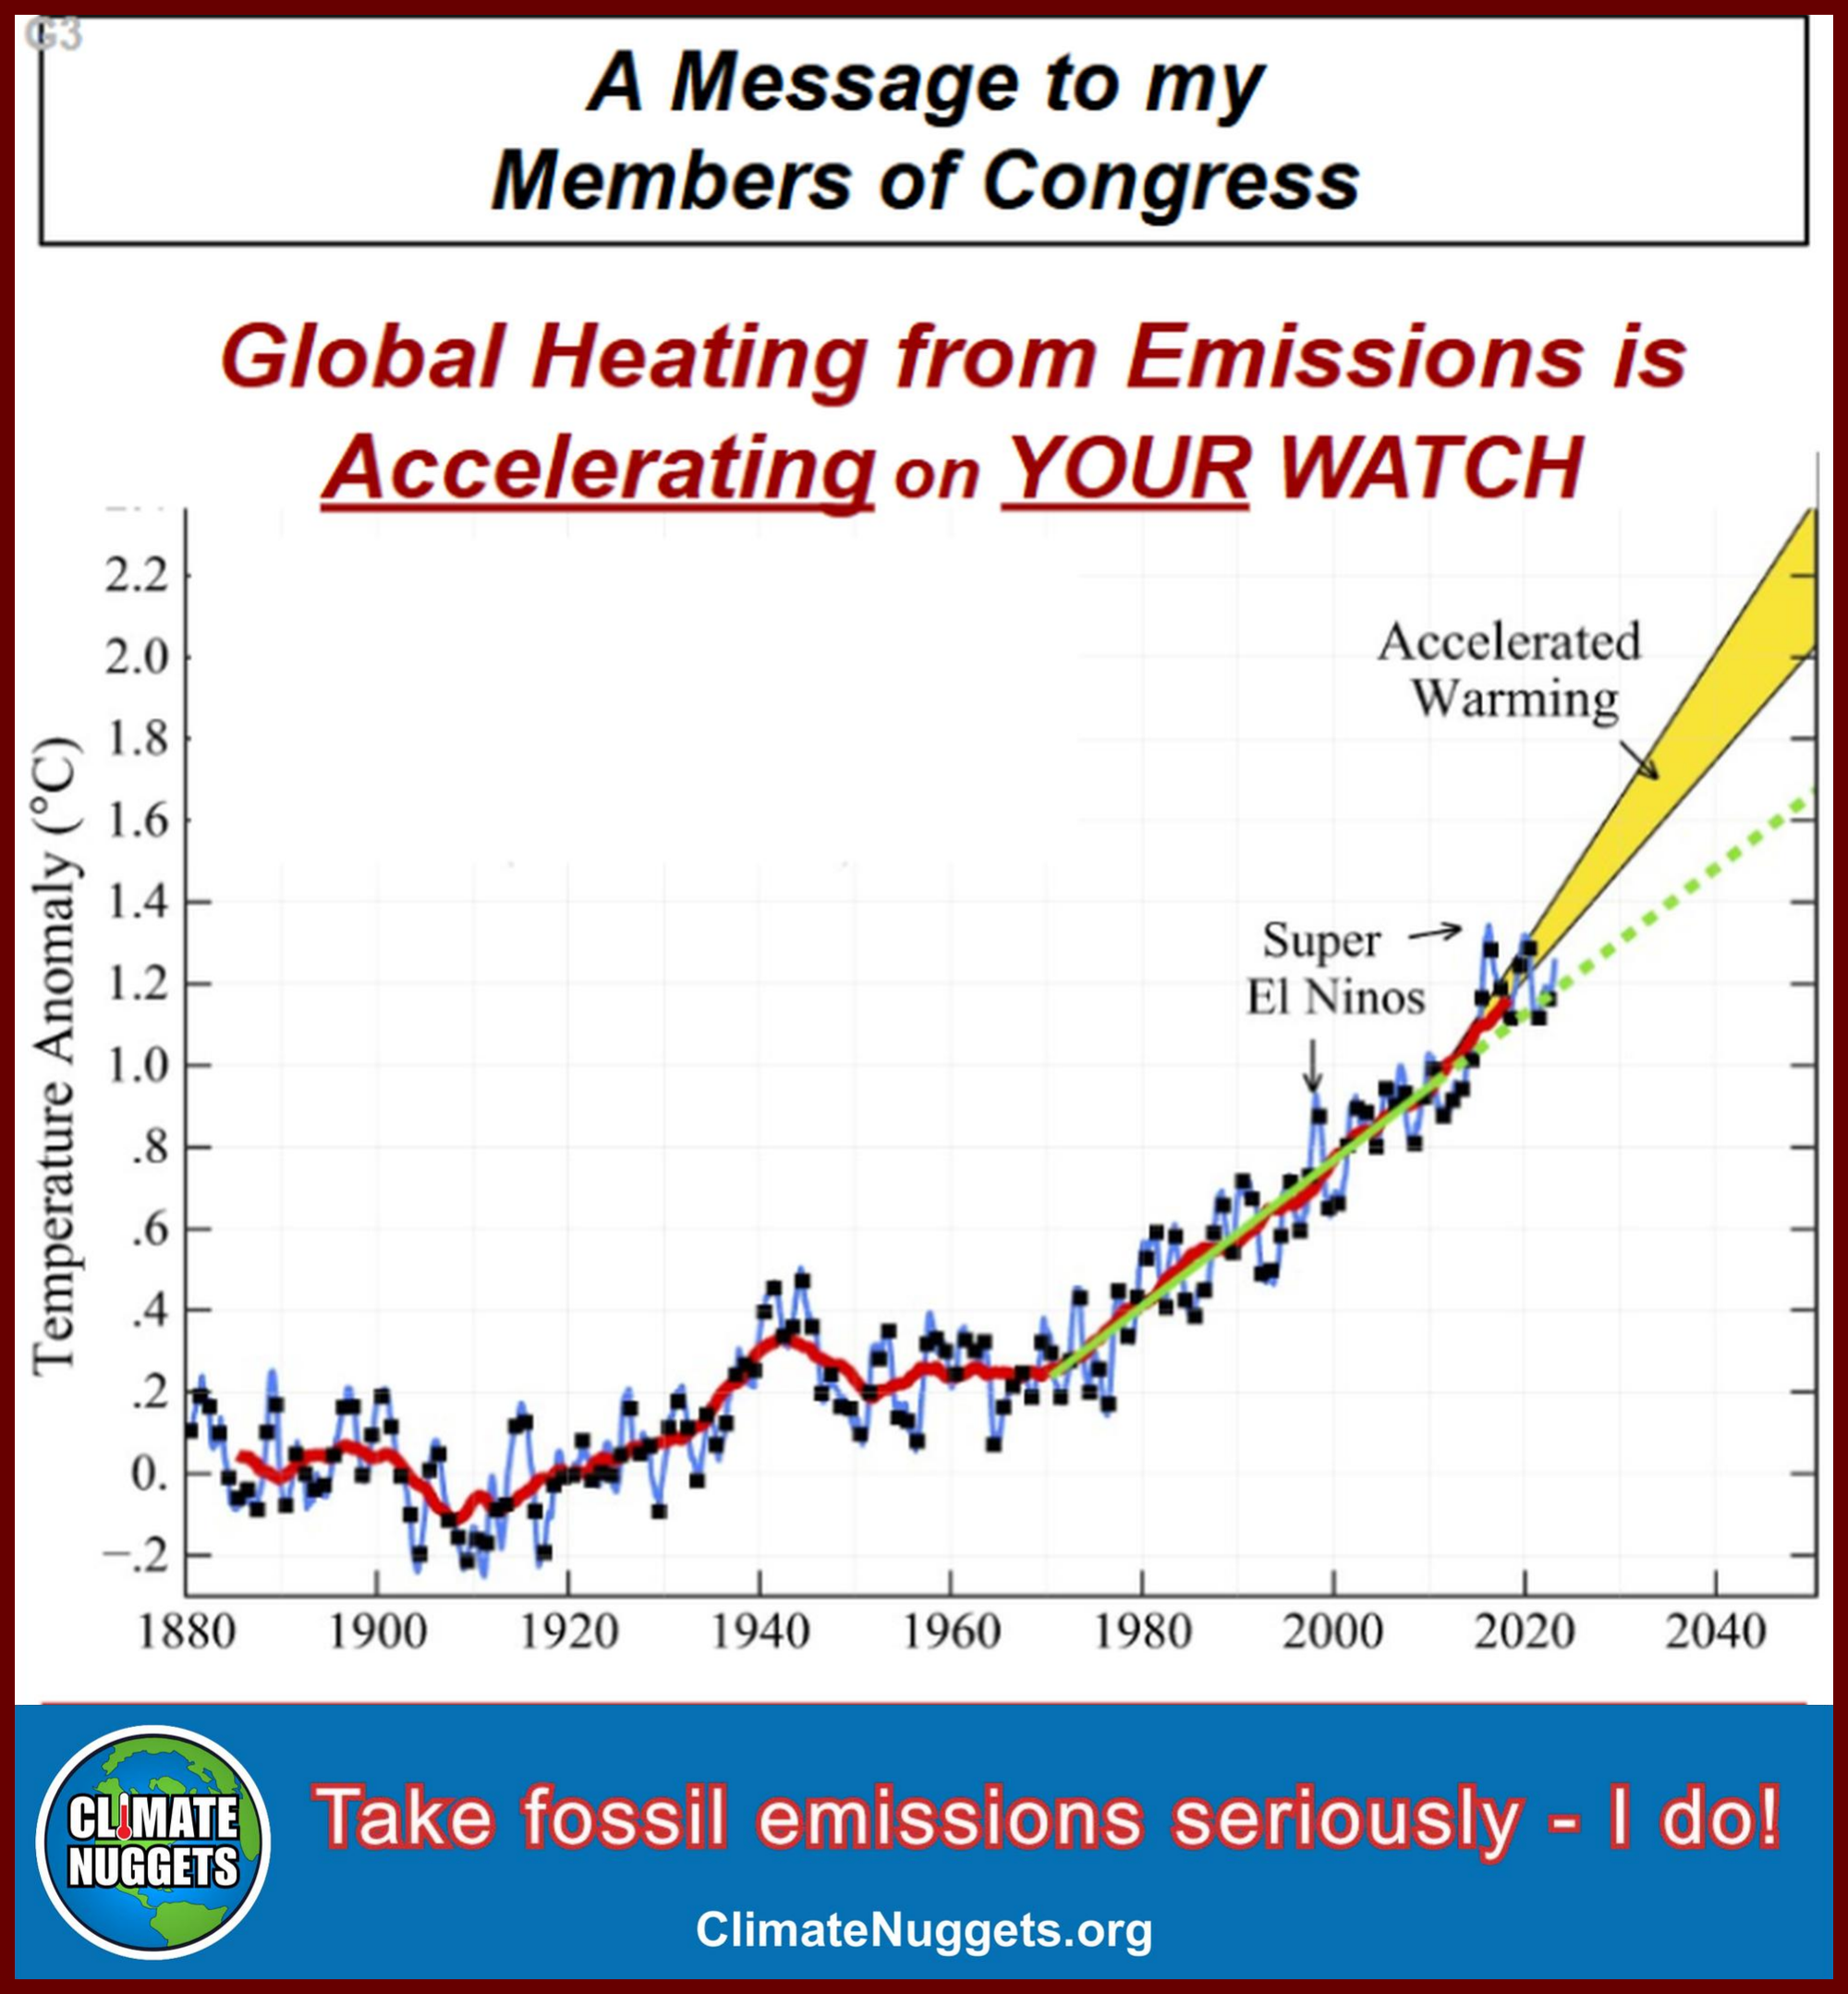
It has become clear in the last 15 years that a fundamental change is underway:  global heating is accelerating.  Since the 1970s, the heating rate had been steady at about 0.2 C per decade. Over the last 10 years, it has doubled to about 0.4 C per decade.  Emissions are the cause!  We are now at 1.5 C above pre-industrial times, where the Paris Agreement set the goal;  with this acceleration, we could hit 2.0 C by 2035 and 2.5+C by mid-century if we don't stop fossil fuel emissions.

Explore Resources for this Nugget:

European Environment Agency:  Atmospheric greenhouse gas concentrations

Hansen:  Warning! This “Colorful Chart” is Censored by IPCC

Just Have a Think:  Our planet is warming TWICE as fast as we thought!

RealClimate:  Much ado about acceleration

Berkeley Earth:  October 2025 Temperature Update

Our World in Data:  Greenhouse gas emissions

Intergovernmental Panel of Climate Change:  Figure AR6 WG2

Hansen:  Global warming in the pipeline | Oxford Open Climate Change

Rhamstorf:  Global Warming has Accelerated Significantly (not yet peer reviewed)

Evidence - NASA Science.

Images of Change - NASA Science

NASA Facebook

Nine Pictures That Show How Climate Change Is Impacting Earth.

G4

G4 — How Emissions Cause Global Heating and Climate Change
G4_hires.png

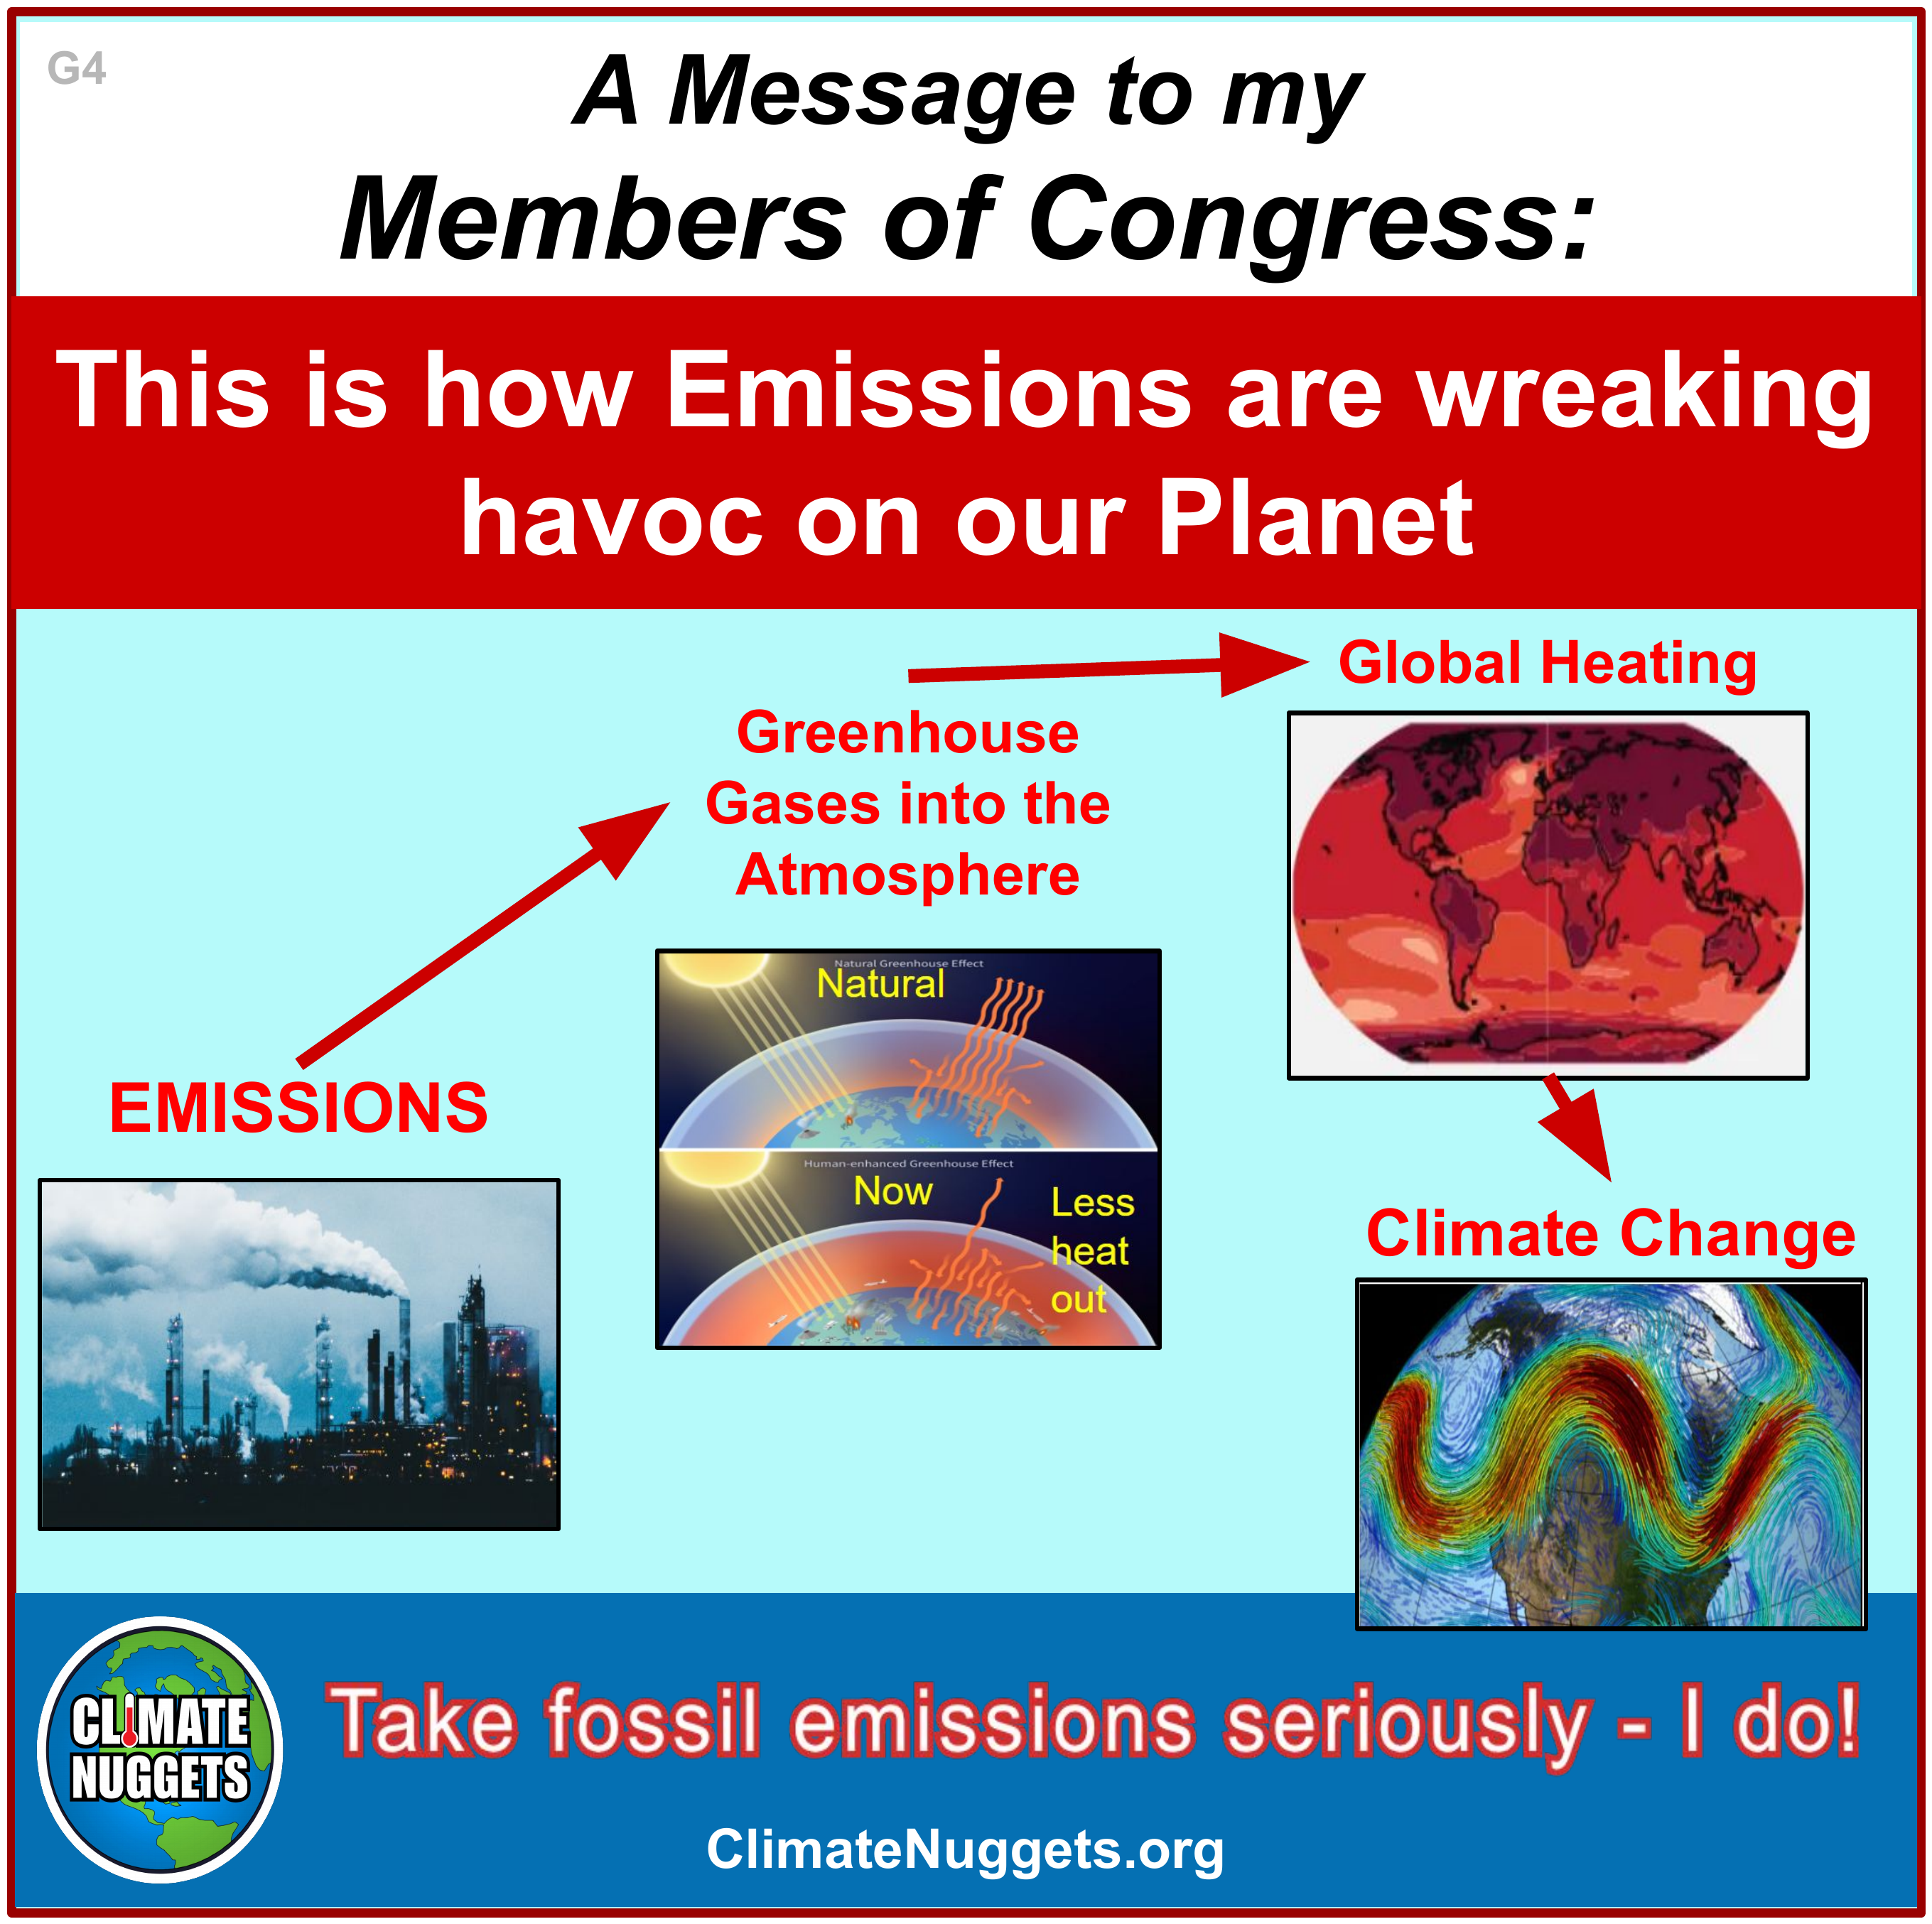
This image lays out the actual mechanism: greenhouse gases from emissions trap heat and are already driving the changes we're seeing. Send it to any rep who wants the 'how,' not just the 'that.

DISCUSSION: We will be talking a lot about Temperatures, Carbon Emissions, and Atmospheric Concentrations of Greenhouse Gases (GHGs). Since these concepts are crucial to our initiative, let’s unpack them a little. CARBON EMISSIONS: These are measured in billions of metric tonnes (tonnes are similar to our 2,000 lb. tons). The idea is that we are dumping fossil combustion wastes and other polluting products. These emissions are not yet distributed into the atmosphere, so are discussed differently from gases in the atmosphere. The critical feature of emissions is that if you stop them, they stop. GHGs in the atmosphere can stabilize if no more are added. GREENHOUSE GASES in the atmosphere - hold in heat, so the planet warms: Once dumped into the atmosphere, the waste products (e.g., carbon dioxide CO2, methane CH4, nitrous oxide N2O, and others) disperse and the conversation is now “what is the concentration of greenhouses gases (GHGs) in the atmosphere?”. We discuss parts per million (ppm) of GHGs in terms of CO2 equivalents (CO2e). At present, we have about 427 ppm of CO2 up there, and around 450 ppm CO2e. The critical feature of GHGs in the atmosphere is that if you stop emissions on the ground, the atmospheric concentrations do not go away - in fact they only decay slowly over centuries (and secondary effects from a warmer planet and changes in land use can keep making things worse). So stopping emissions can help stop the planet from getting even warmer, but the planet doesn’t cool for a long time because the GHGs are still there acting like a blanket. TEMPERATURE RISE (global warming): We often talk about how much the planet is warming since the beginnings of the Industrial Age (around 1750). When we talk about a 1.5 deg C increase (about 2.7 deg F), that was the goal set in Paris in 2015 to ensure a reasonably stable planet. We’re now past this. The actual average temperature is not as important as the temperature rise. As you will see, Temperature rise is caused by the concentration of greenhouse gases in the atmosphere - primarily from emissions (which we control). CLIMATES CHANGE: Global heating inevitably results in changes in regional clin=mates - rising sea levels, stronger droughts, higher humidities. flooding, movement of species to more hospitable environs, more intense precipitation, loss of groundwater, movements of seasonal monsoons away from farmland, etc., etc,,

Explore Resources for this Nugget:

Climate in Arts and History:  Greenhouse Effect


NOAA Climate.gov:  What Are Greenhouse Gases and Why Do They Matter

G5

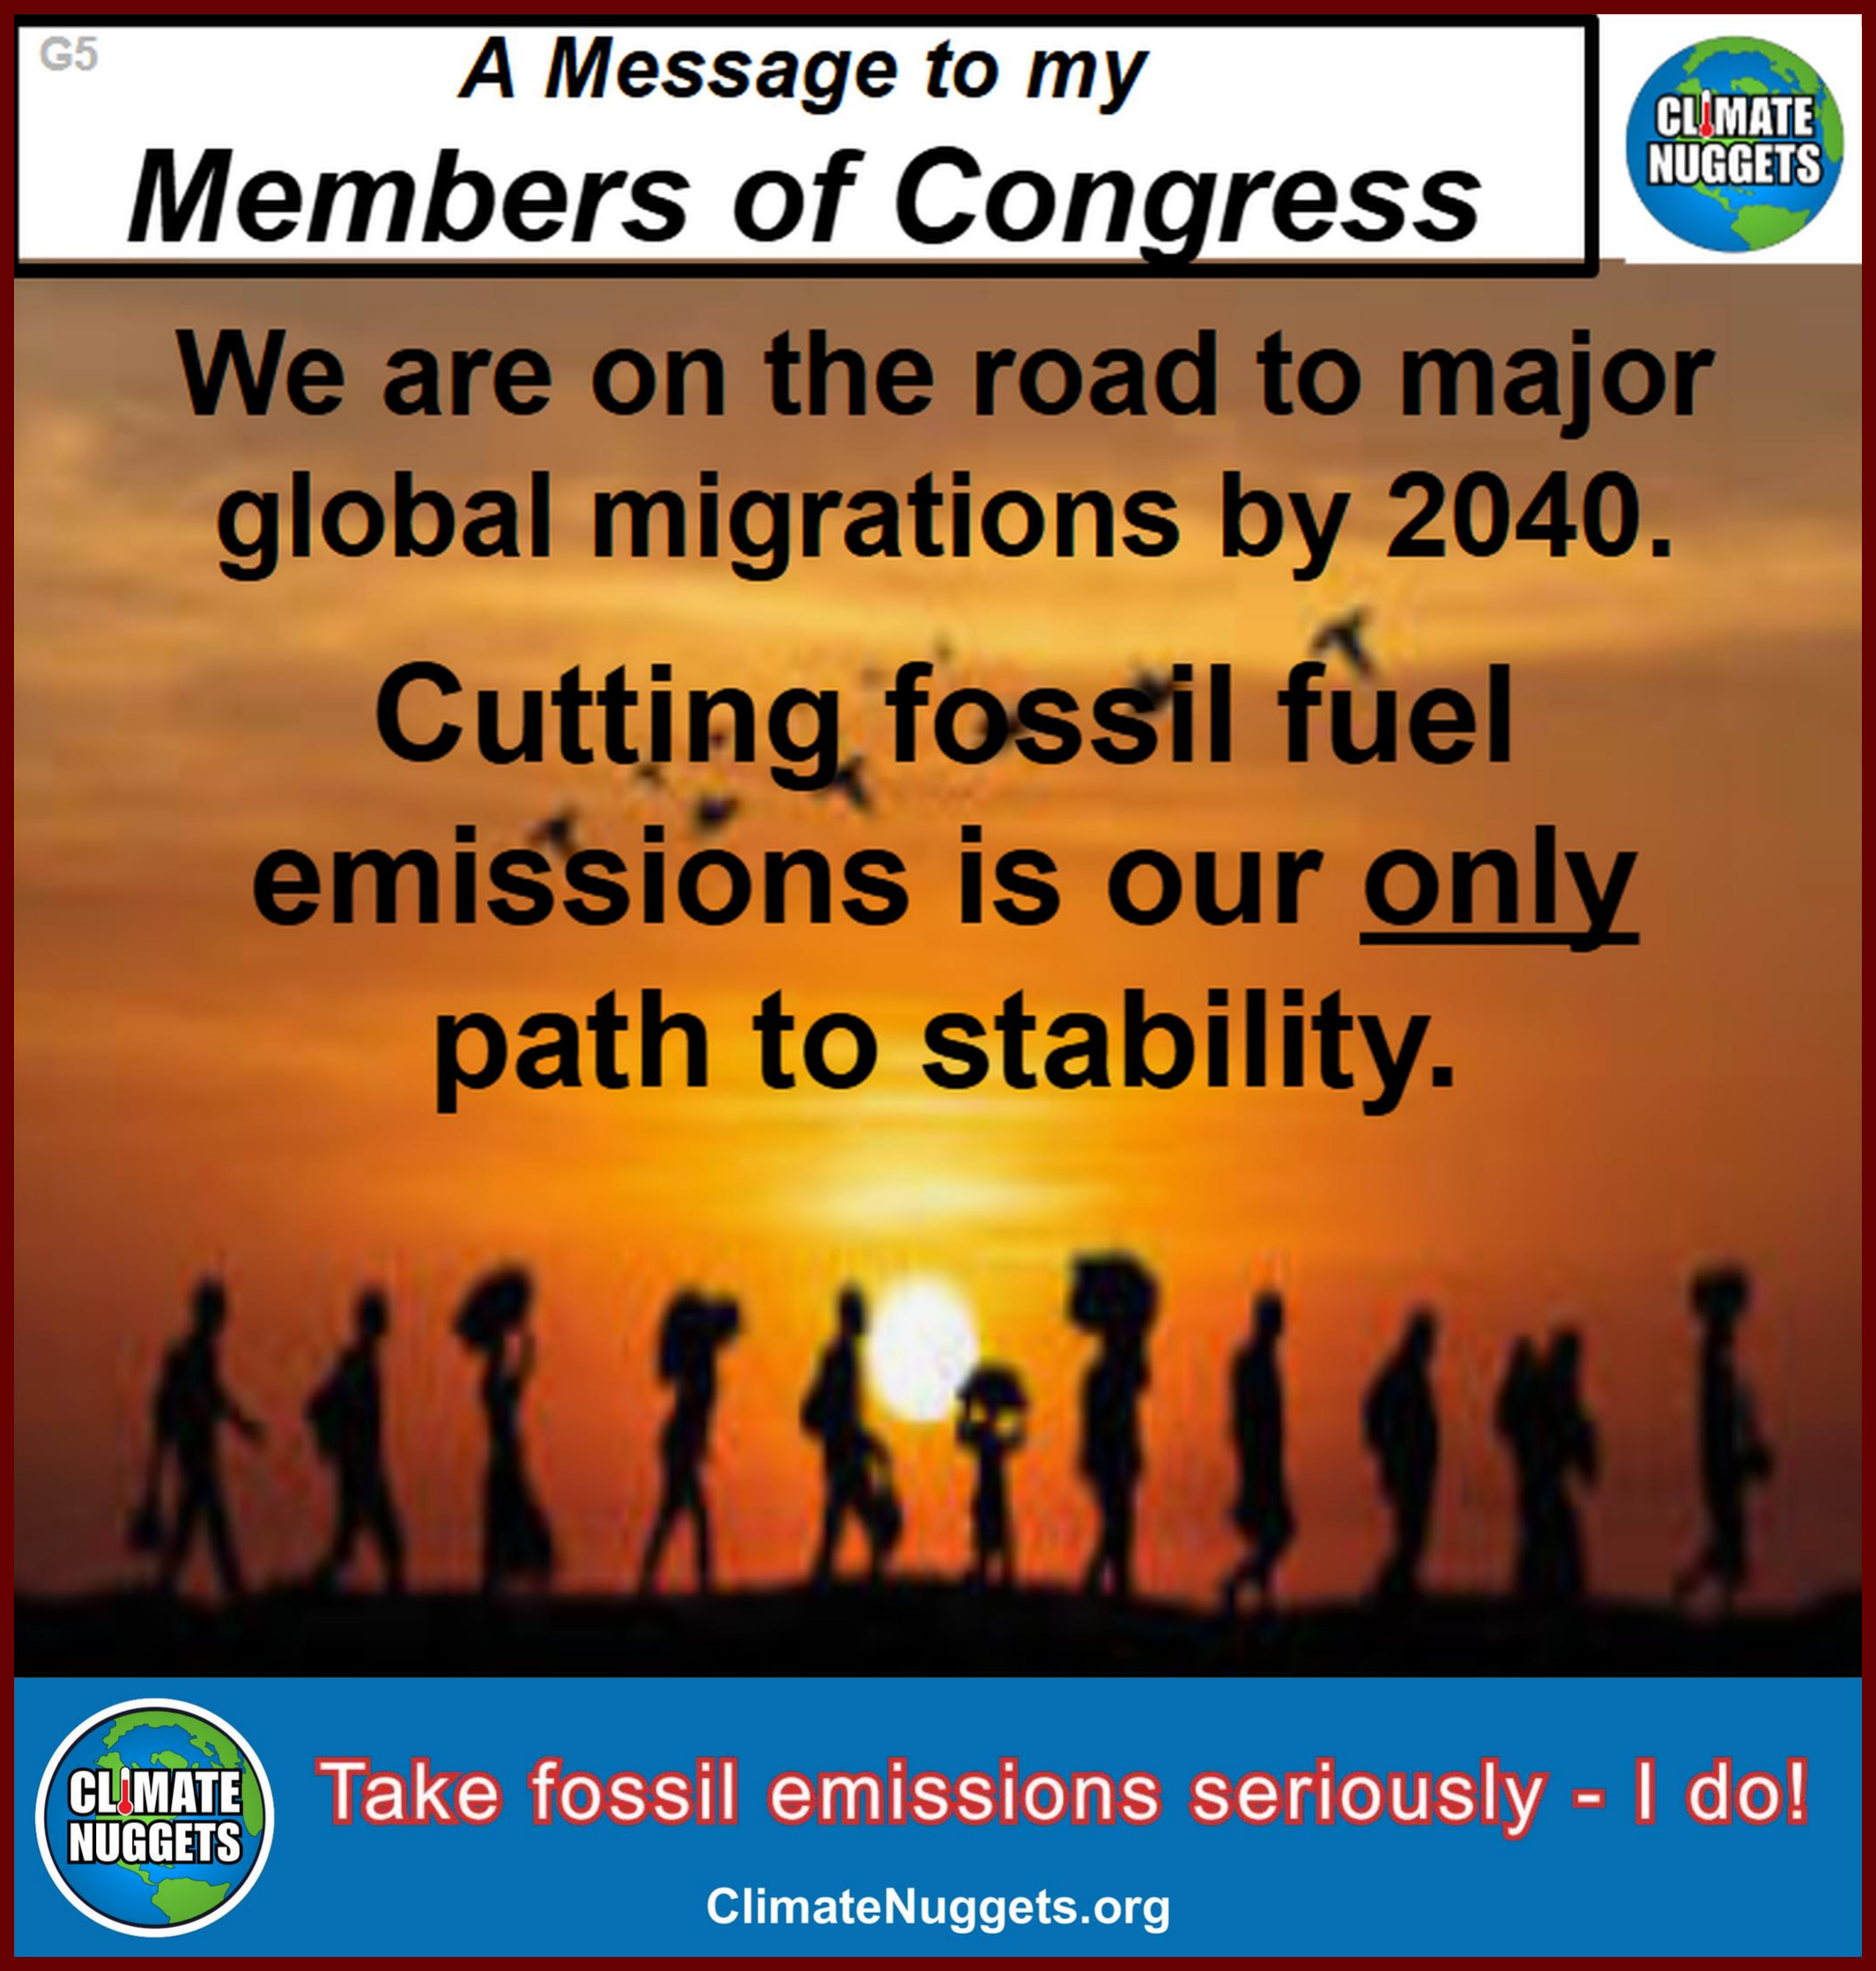
G5 — Global Migrations Are Coming Unless We Cut Fossil Emissions
G5_repaired.png

This chart captures our assessment that, if we keep on our current emissions trajectory, major areas of the planet will likely become virtually uninhabitable this half of our century.  Resources may be fought for and large populations displaced.  Global stability is at greater risk from Global Heating.

Explore Resources for this Nugget:

G6

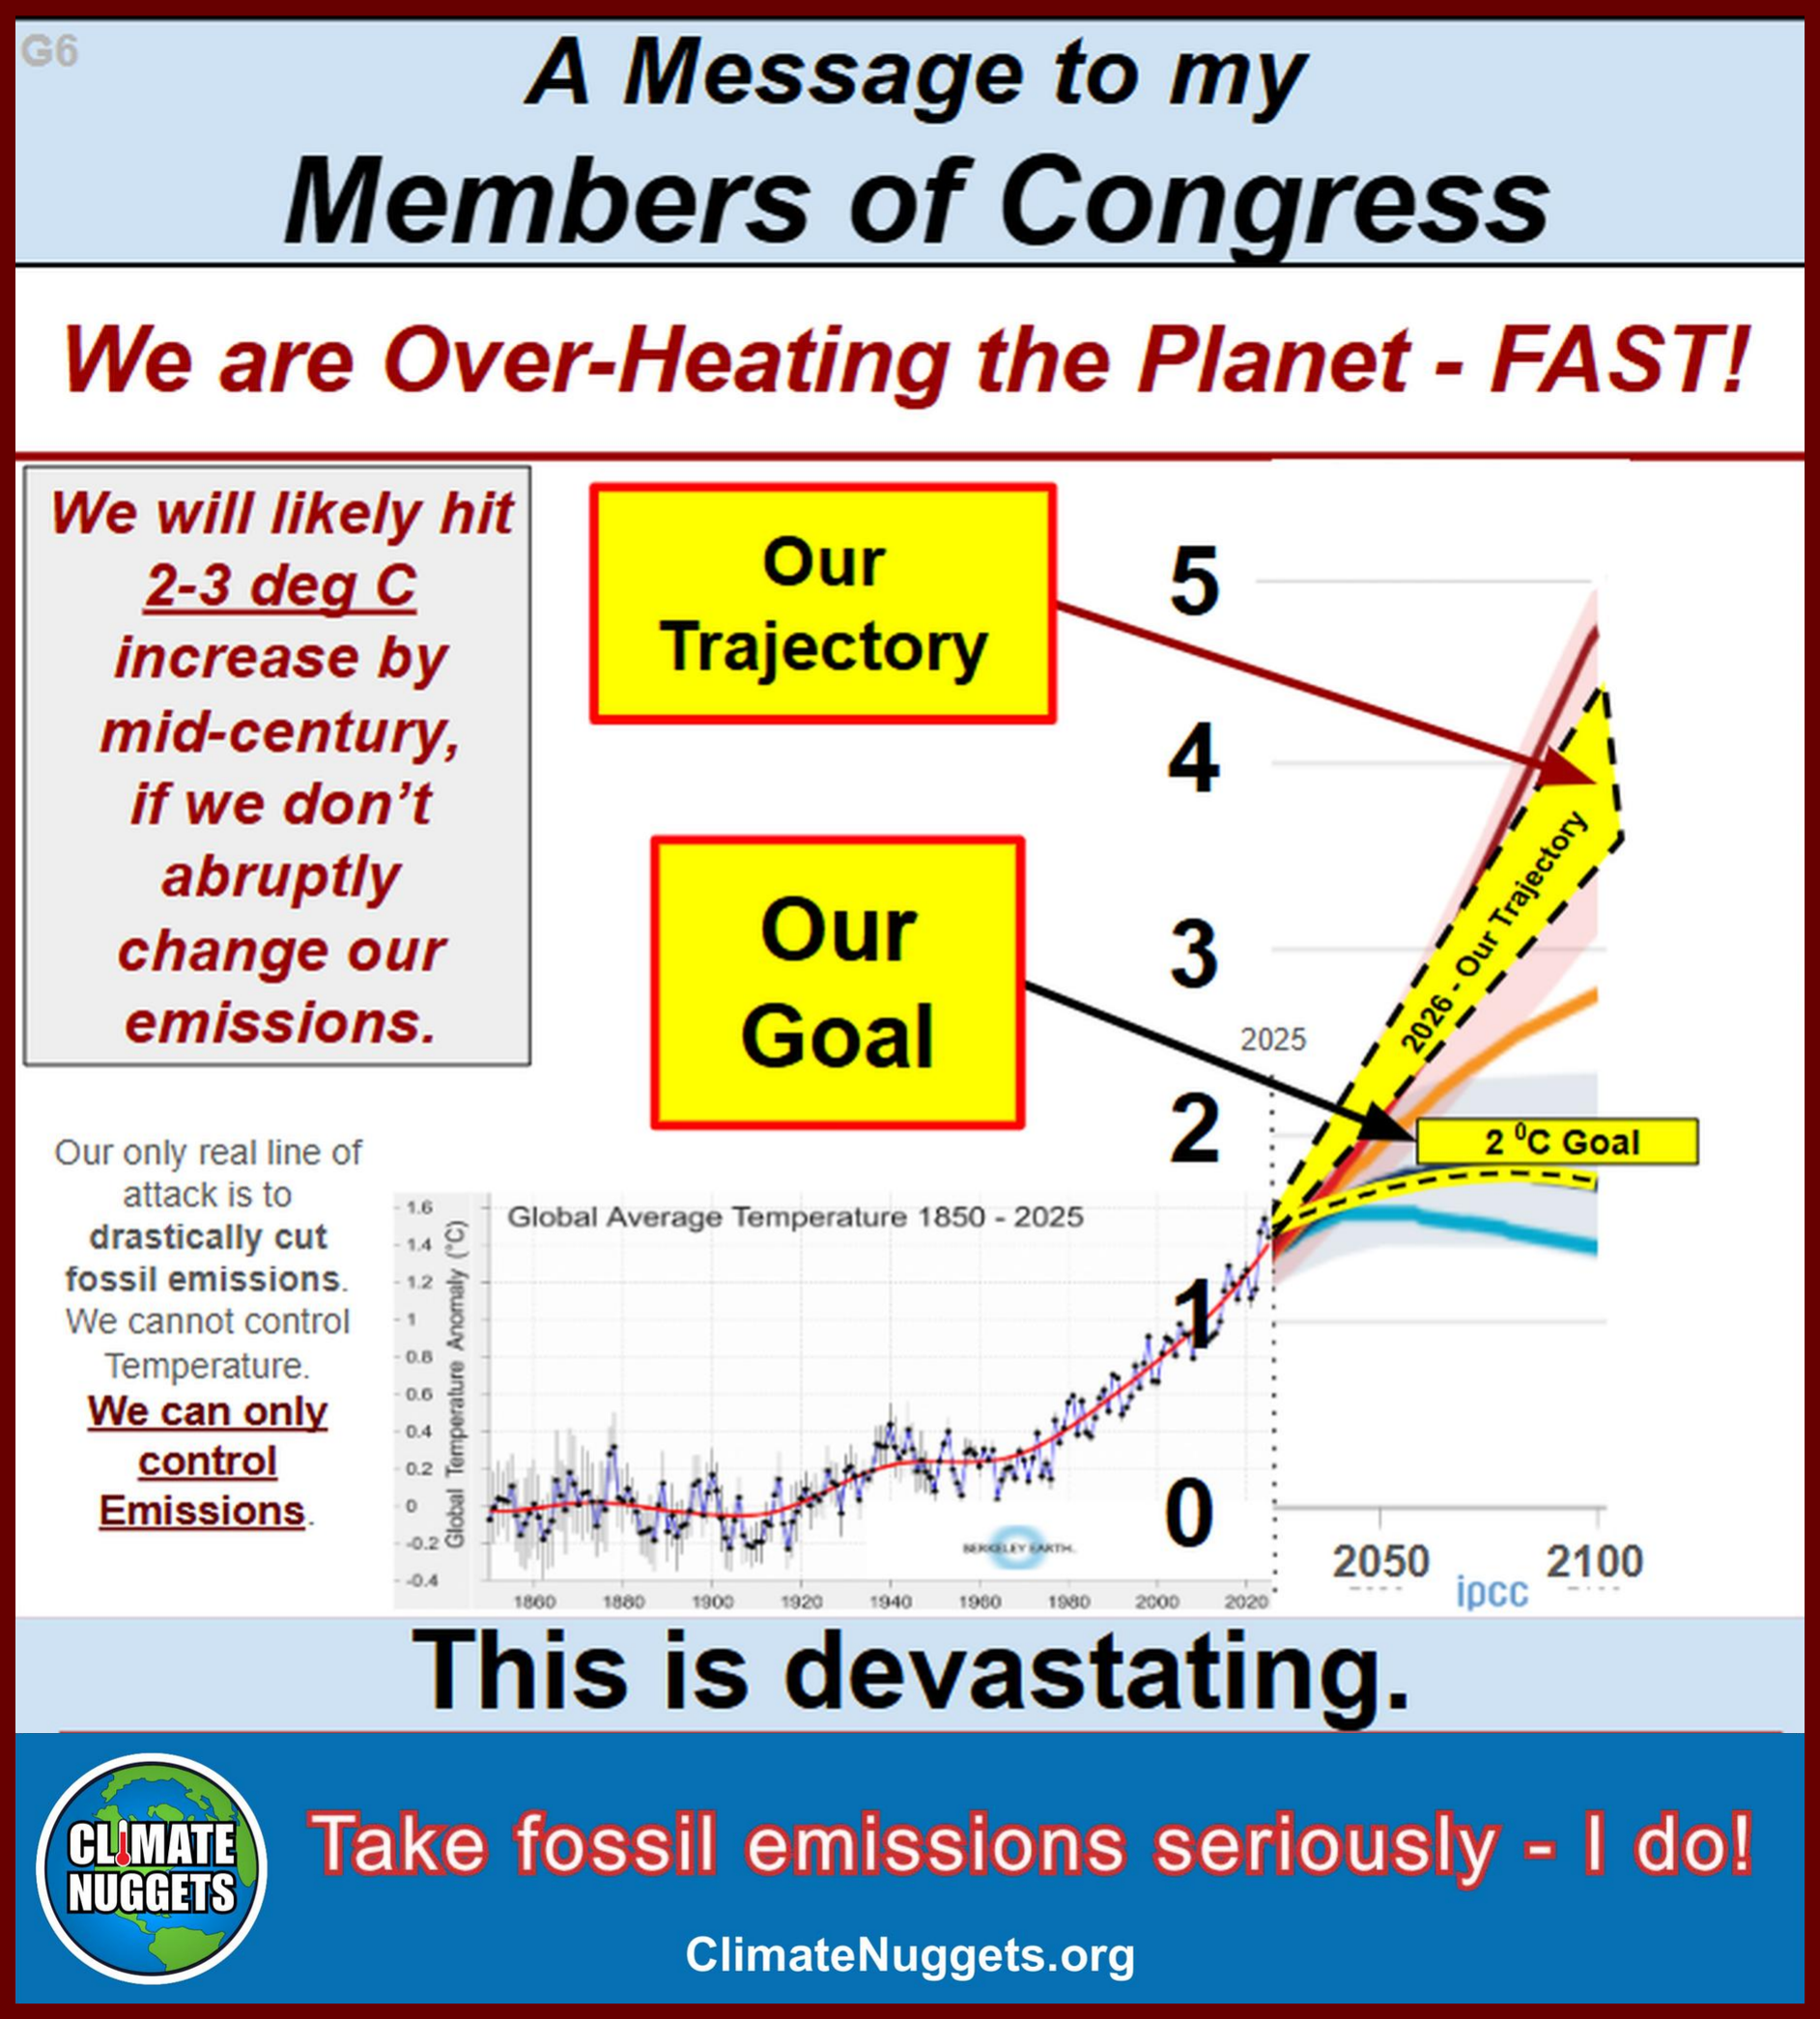
G6 — Our Heating Trajectory Is Far Faster Than Our Goal of 2°C
G6_repaired.png

This chart captures historic data and couples it with IPCC scenarios.  We have added a direct extrapolation of actual emissions trends, and it doesn't look good.  If we don't severely cut emissions, we are likely to endure devastating impacts by mid-century.  And the likelihood of adequately cutting emissions through human behavioral changes, to achieve what is considered the upper limit of reasonable living (2 C), is assessed by us as not credible.

Explore Resources for this Nugget:

G7

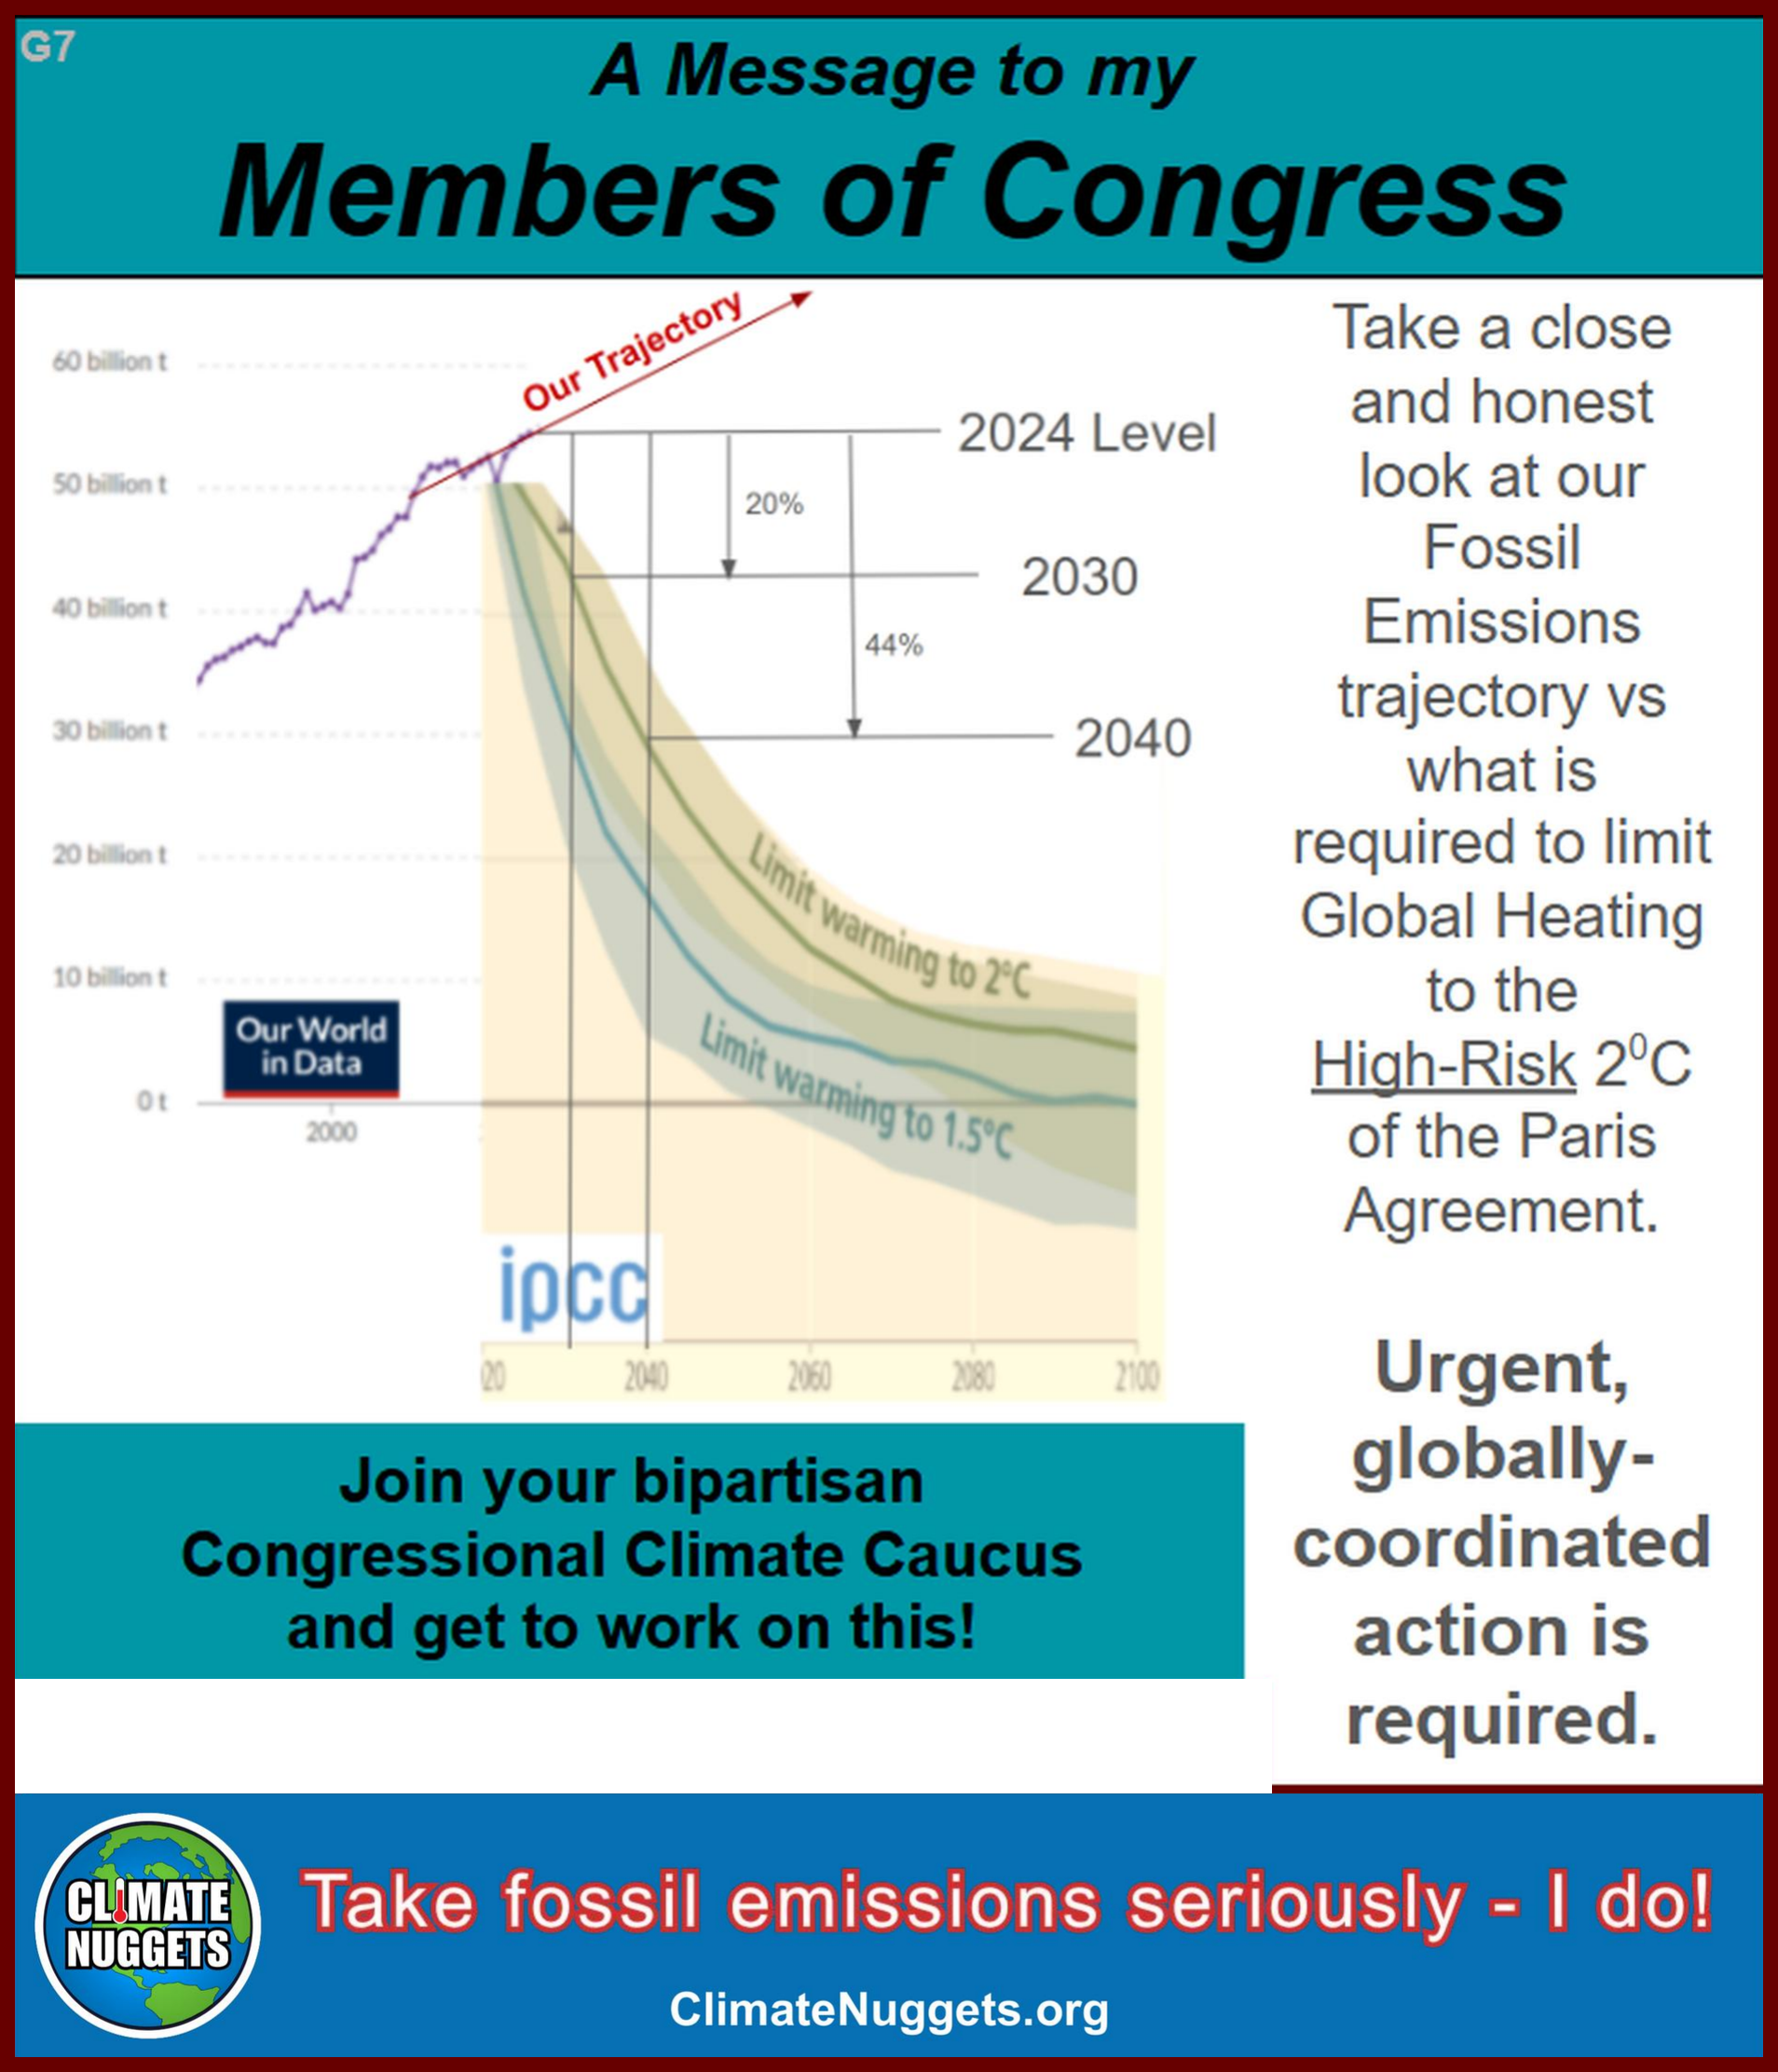
G7 — Urgent, Globally-Coordinated Action Is Required
G7_repaired.png

This chart shows actual emissions data and a reasonable extrapolation (our trajectory) into the future.  Compare that with the IPCC scenarios which can hope to keep the global temperature rise to under 2C.  Clearly, drastic emissions reductions are required: 45% by 2040!.  We need Leaders in Congress to educate the public and make this happen.

Explore Resources for this Nugget:

Our World in Data: Greenhouse Gas Emissions

IPCC: Figure SPM.5 AR6 WG2

Climate Nuggets: Timing and Impacts Study

Climate Nuggets: Study:  Emissions Goals for the US  

G8

G8 — Erratic Weather Is Getting Worse

G8.png

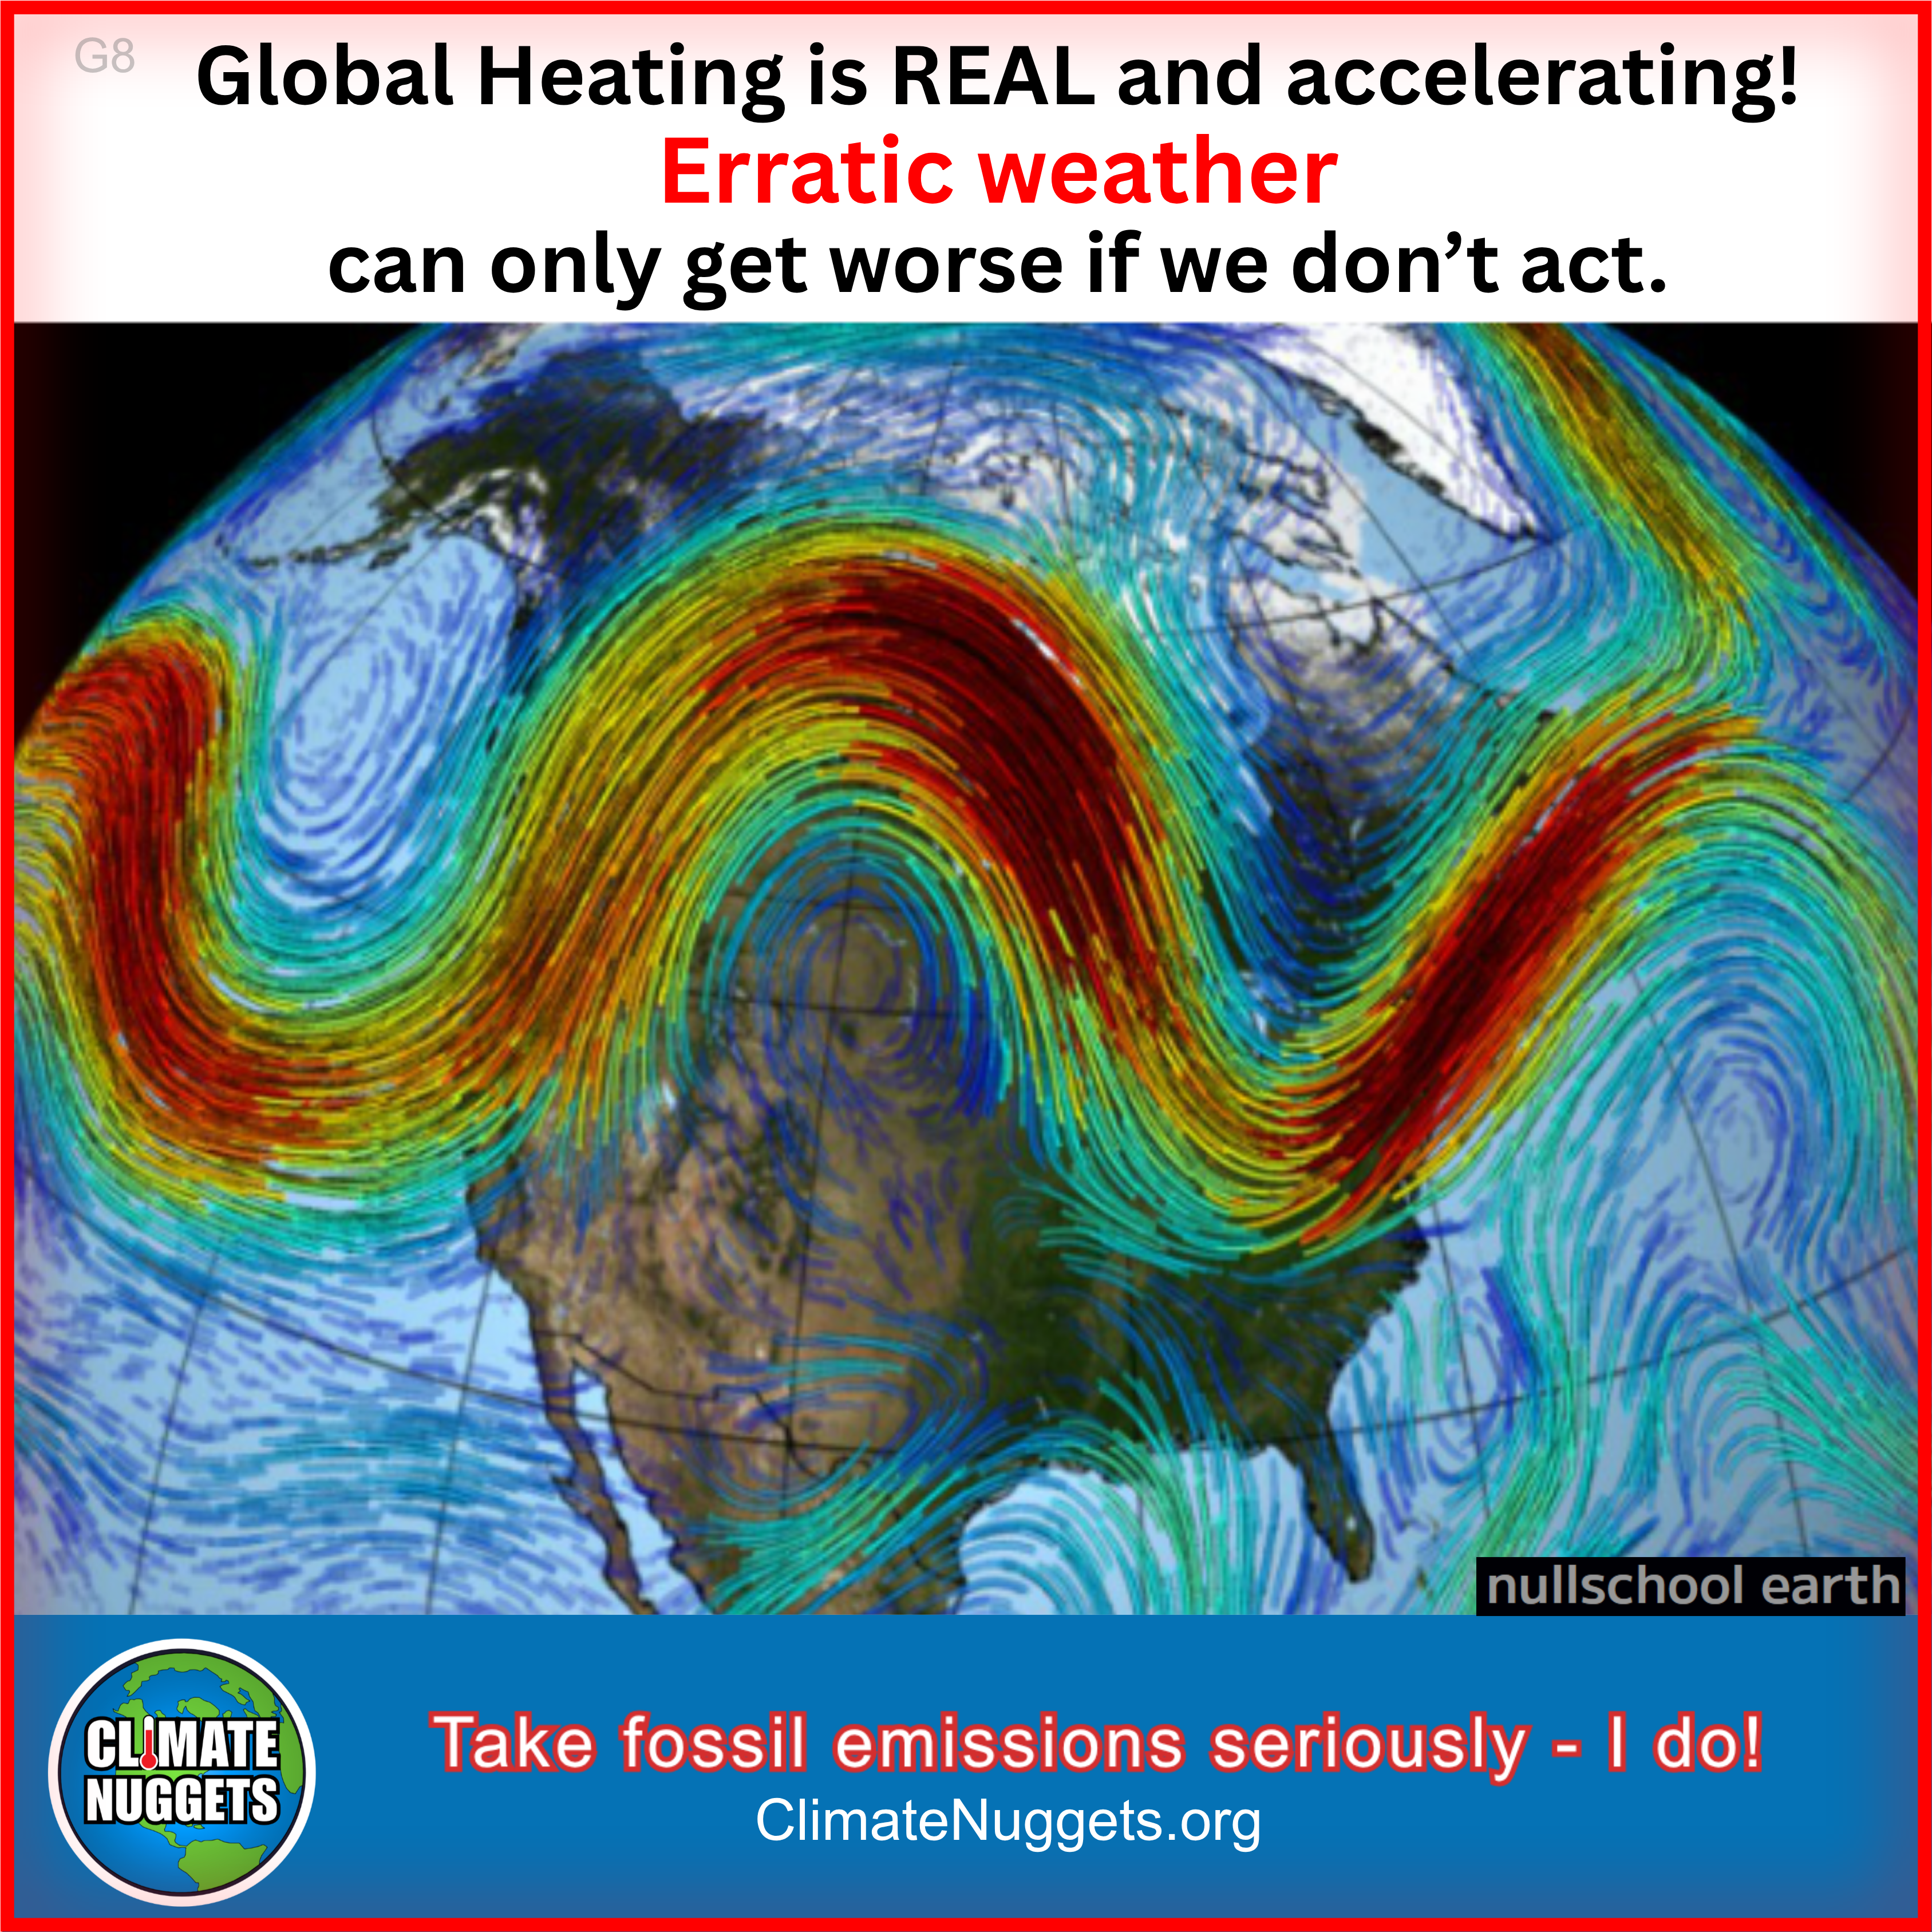
Global Heating drives intensifying and  more erratic weather.  Since the poles warm faster as they lose ice and absorb more sunlight - the flow of air from the warm equator is lessened.  This means the jet streams, which are driven by that flow, get weaker.  This results in the wavy patterns locking in extreme conditions.  And it's deteriorating faster than expected.

G9

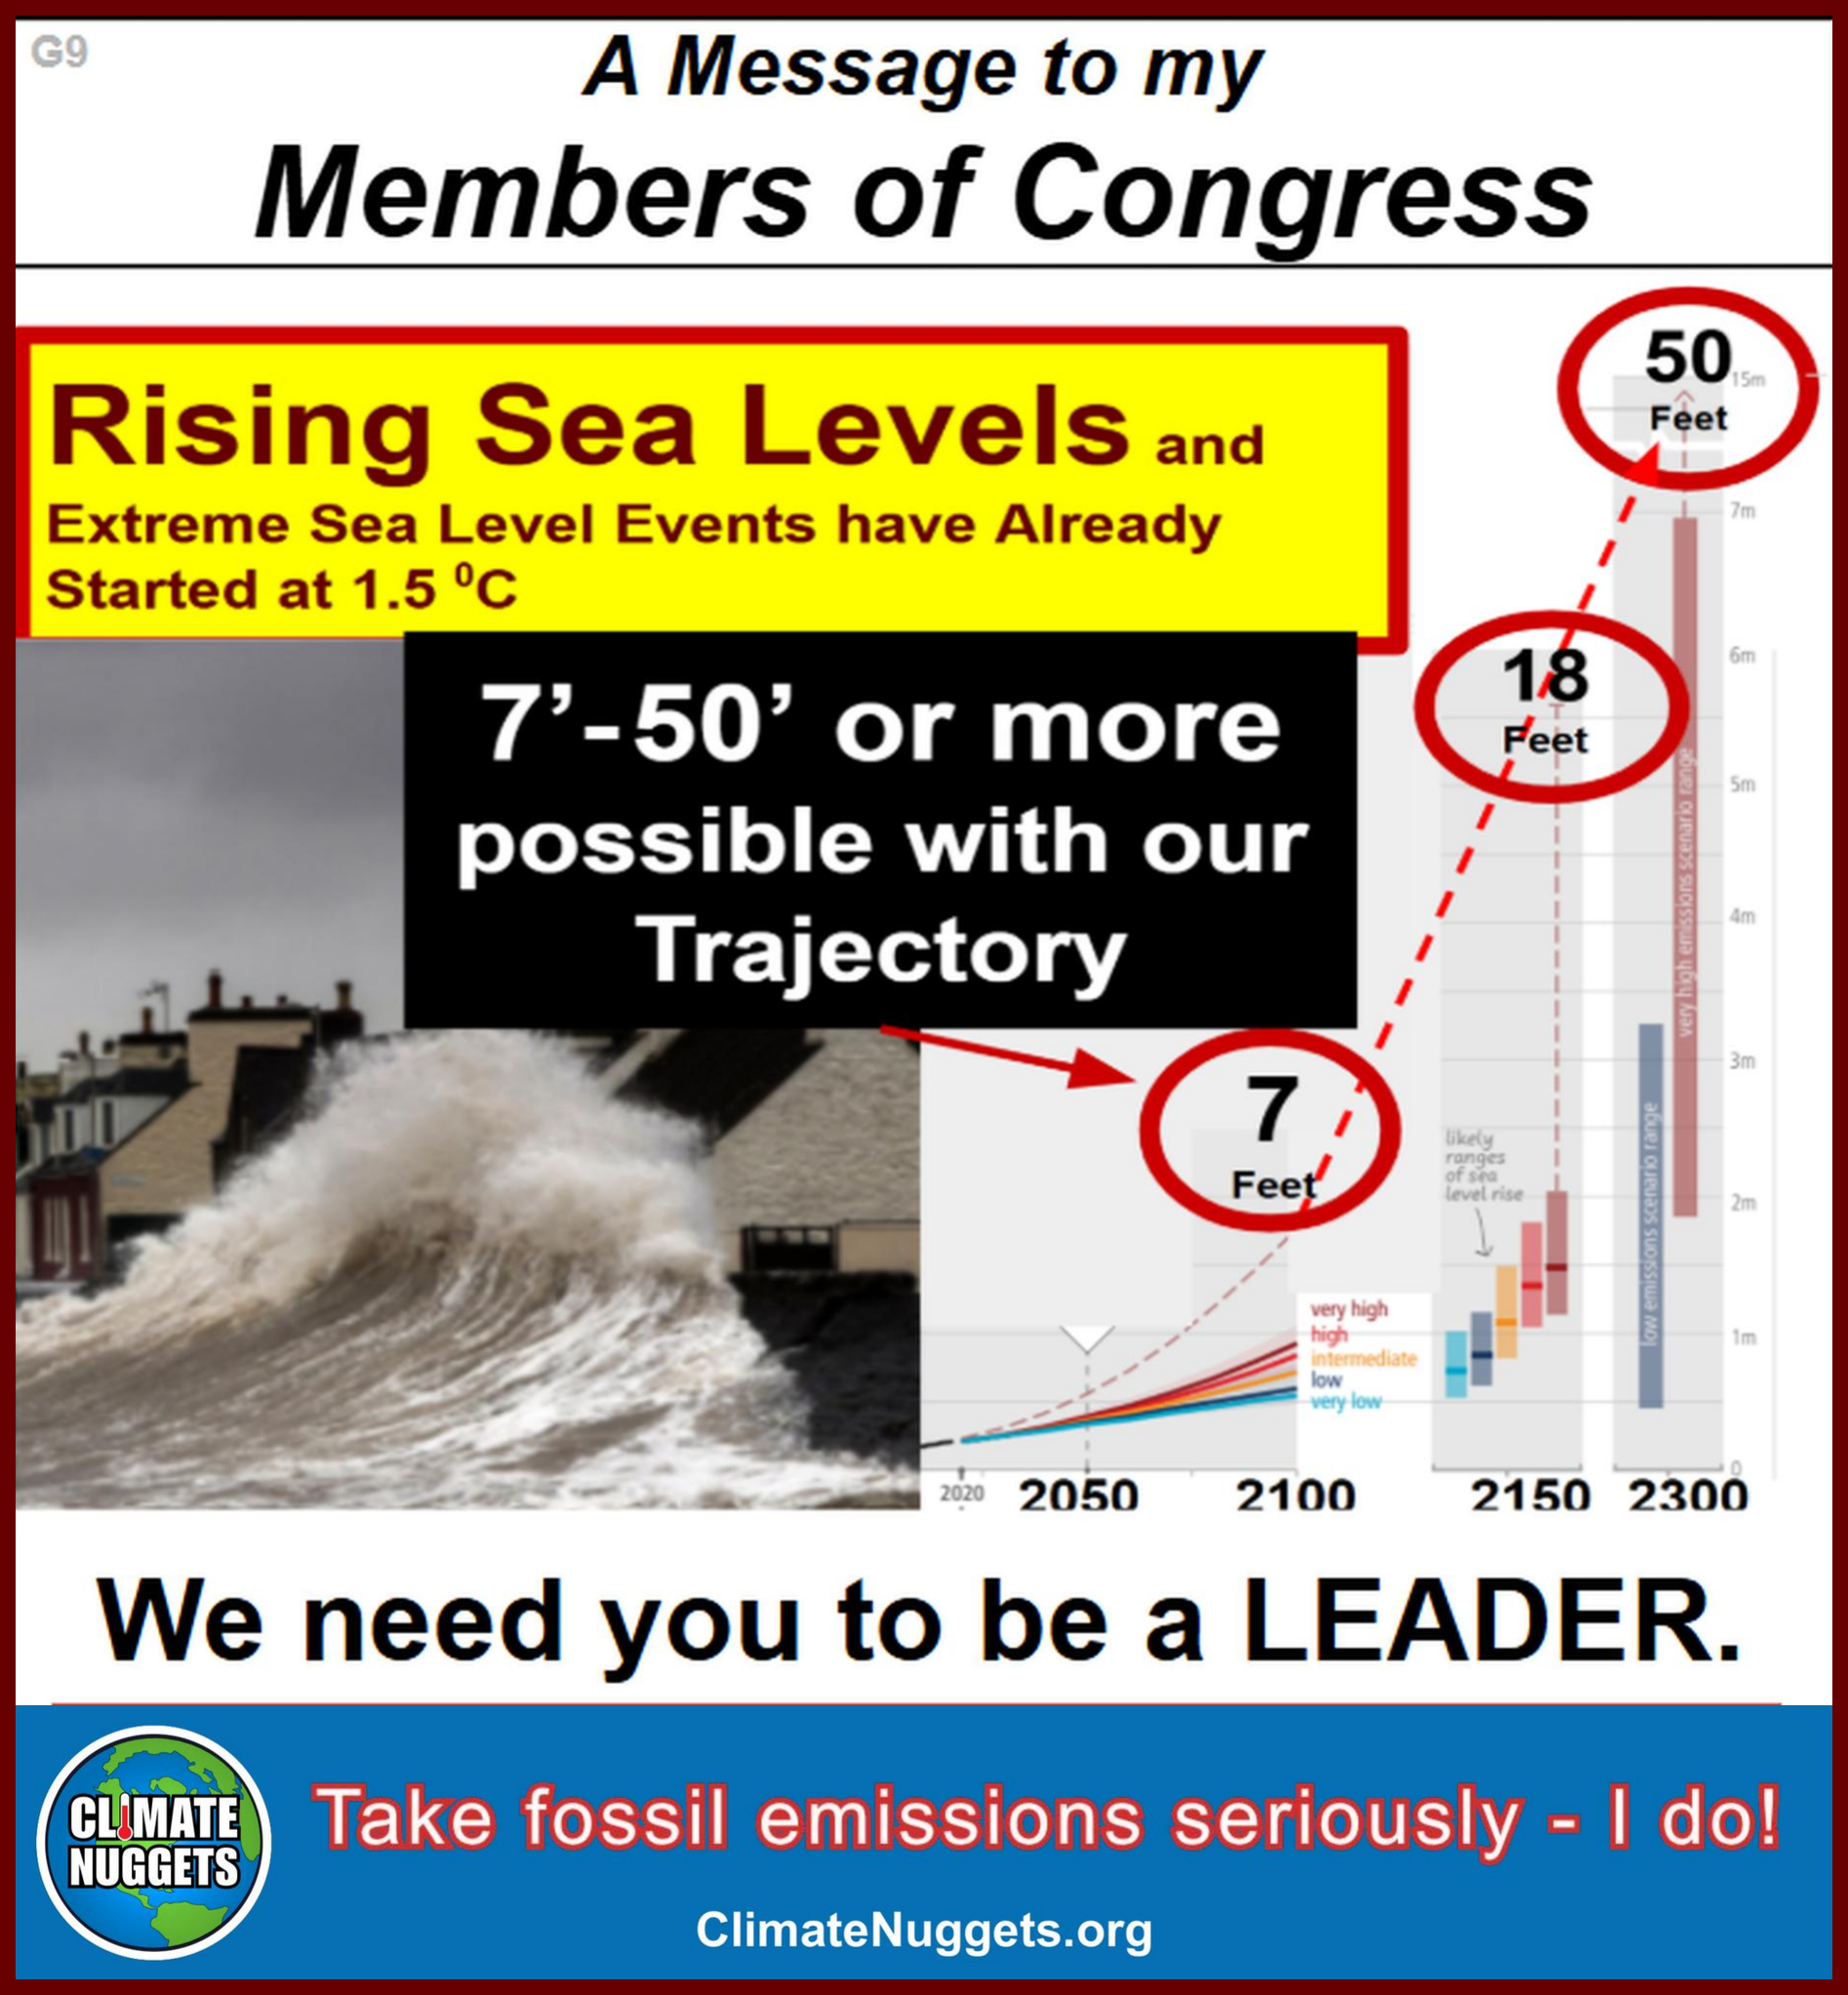
G9 — Rising Sea Levels and Extreme Events Have Started
G9_repaired.png

This chart presents two major impacts of climate change.  Wacky weather  including more powerful hurricanes together with sea level rise bring more extreme sea level events already.  Also, looking to the future with our current trajectory, we may well endure enormous sea level rise directly from the heating of water and melting of  ground-based ice, and indirectly from tipping points likely to occur this century.  

Explore Resources for this Nugget:


Intergovernmental Panel on Climate Change:  

Climate Change 2023 Synthesis Report p.46


European Geosciences Union:  Ice melt, sea level rise and superstorms: evidence from paleoclimate data, climate modeling, and modern observations that 2 °C global warming could be dangerous


Scientific American:  A Wacky Jet Stream Is Making Our Weather Severe


The Washington Post:  Extreme jet stream pattern brings bizarre weather, storms to Lower 48


US Global Change Research Program (USGCRP):  U.S. Fifth National Climate Assessment

Intergovernmental Panel of Climate Change:   Climate Change 2023 Synthesis Report p.46

Climate Nuggets Study:  Climate Science and Likely Futures - in Graphics  A Global Perspective

G10

G10 — Heat-Humidity Risk to Human Health Has Only Just Started
G10_repaired.png

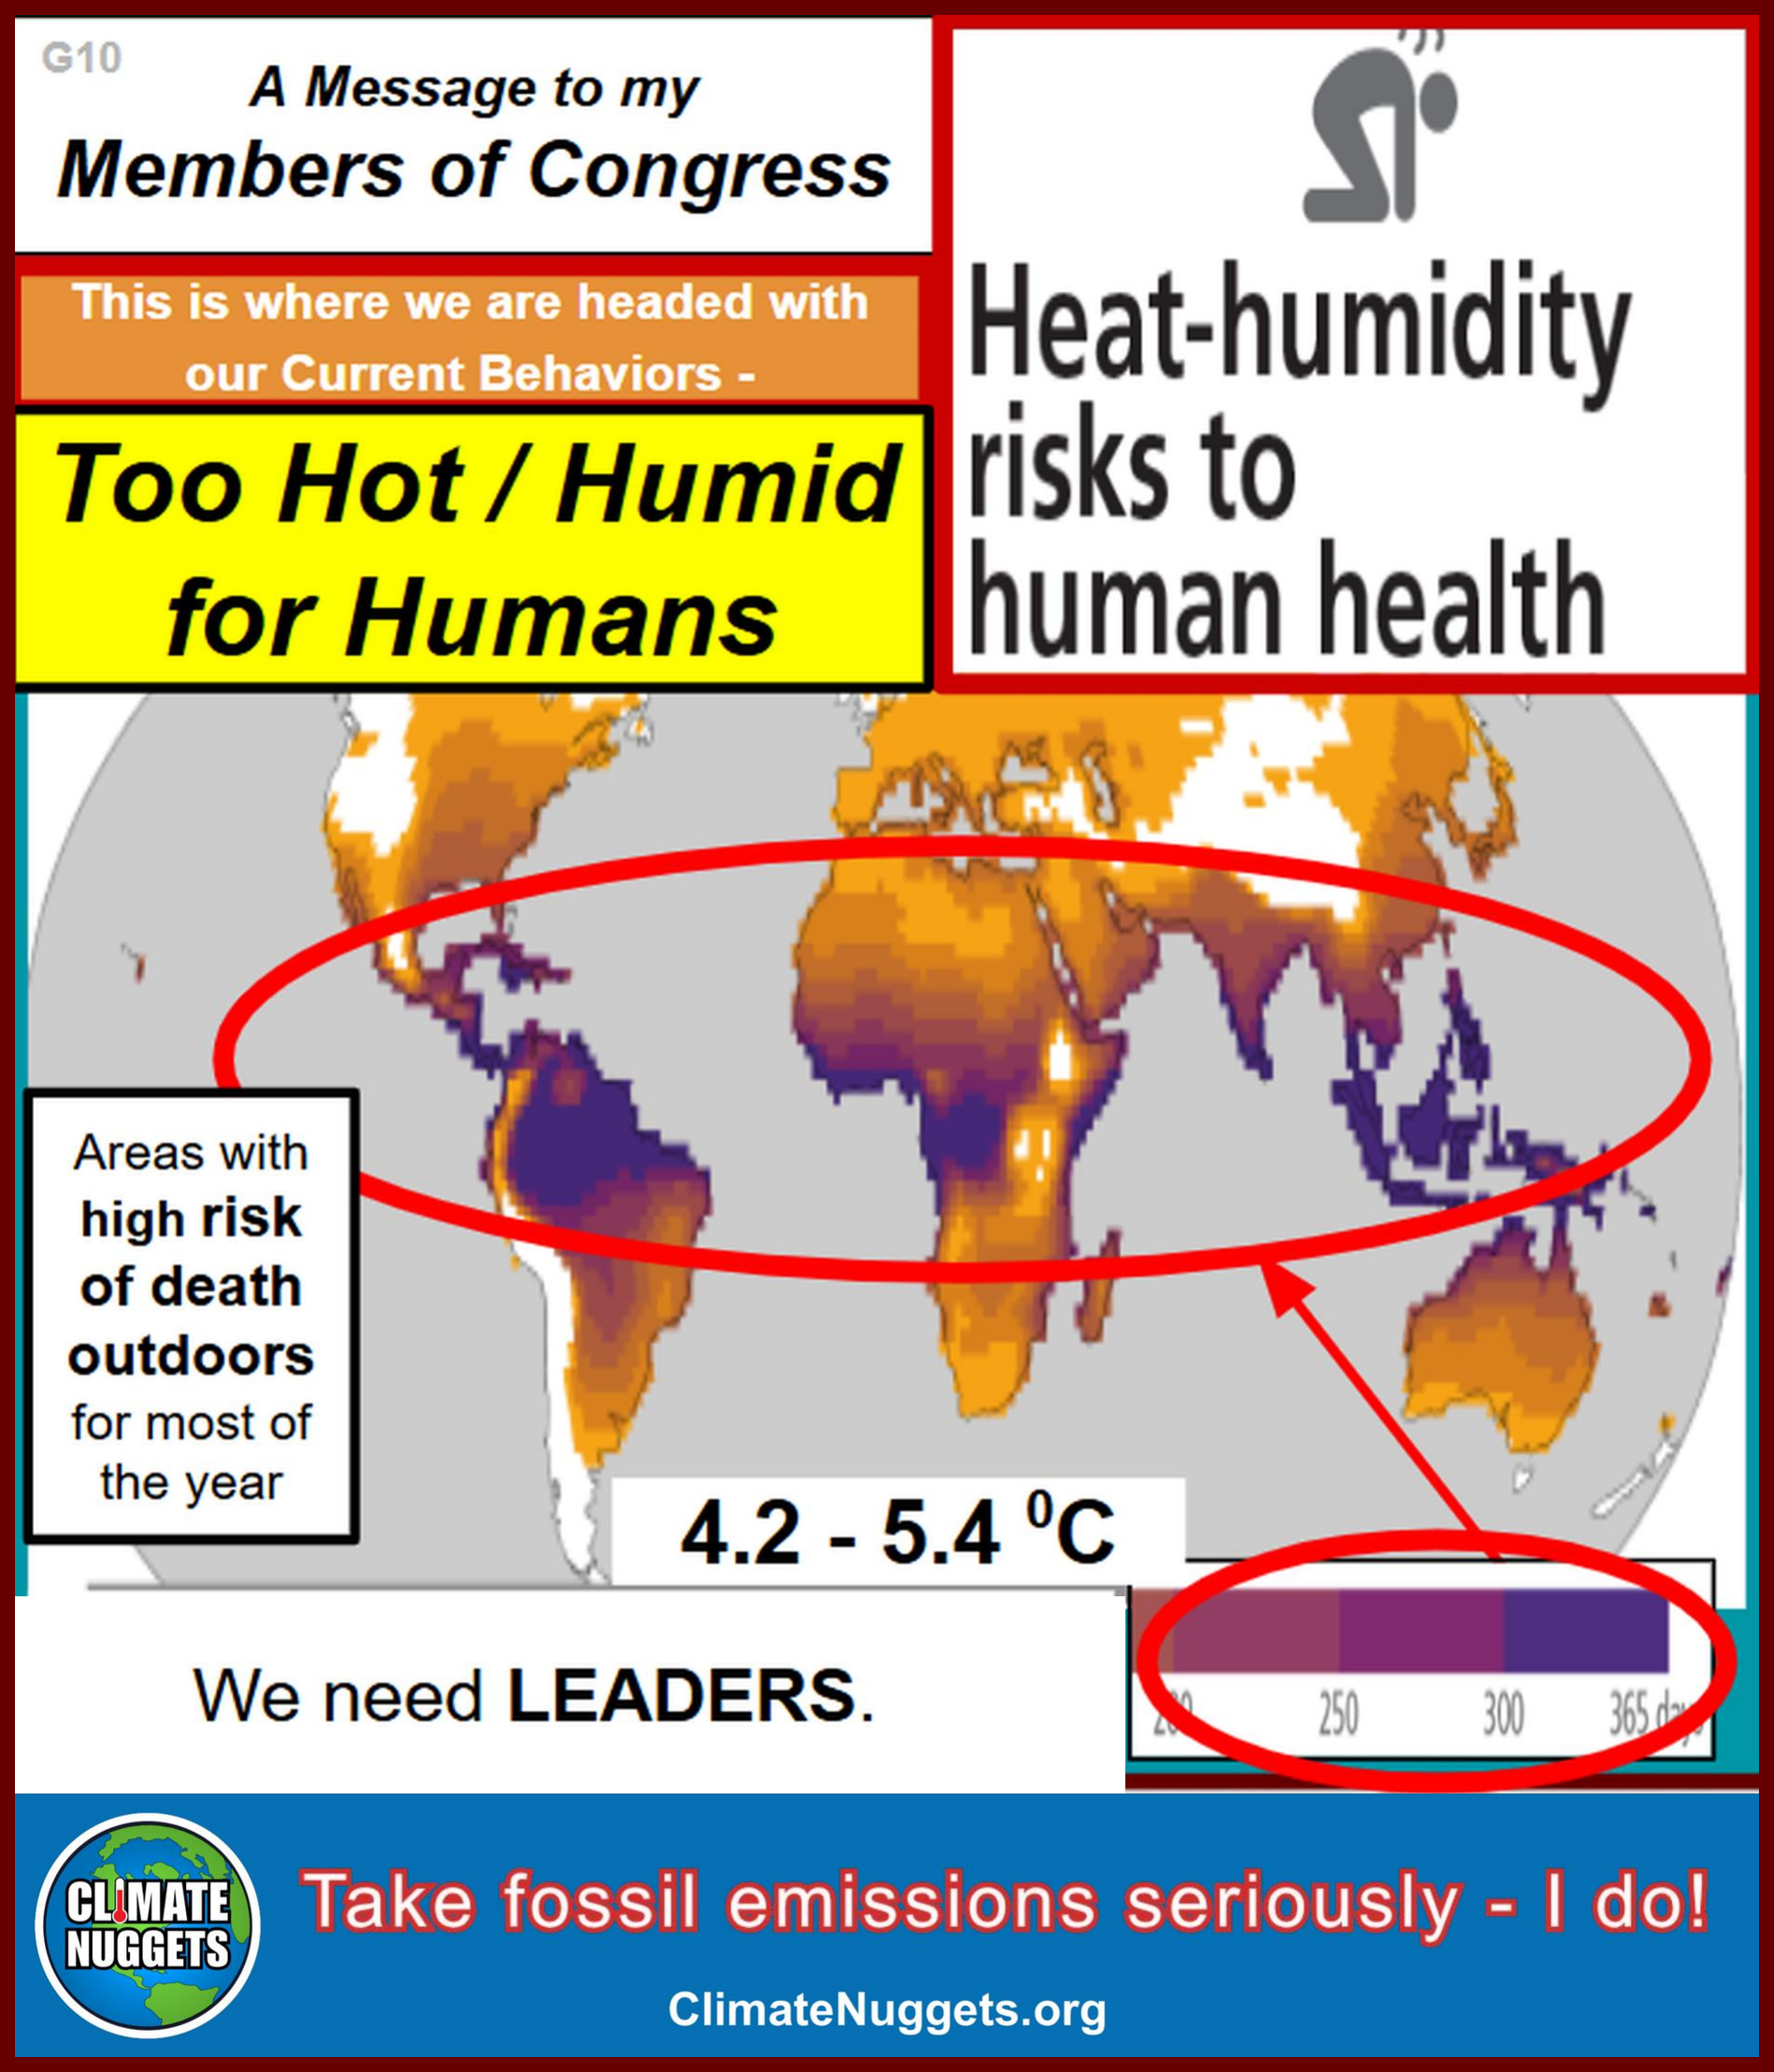
This chart keys off the IPCC assessment that on our current trajectory large currently inhabited regions of the earth may not be livable this century.  Our assessment is that global societal disruption is likely by mid-century without immediate drastic reductions of emissions.

Explore Resources for this Nugget:


Intergovernmental Panel on Climate Change:

Forward and Technical Summary  C.4.1, C.3.1, C.3.3, C.6.5, SYN 3.2

Climate Nuggets: Timing and Impacts Study

Climate Nuggets: Study:  Emissions Goals for the US

Climate Nuggets Study:  Climate Science and Likely Futures - in Graphics  A Global Perspective

G11

G11 — Enormous Destruction of Species Is Underway
G11_repaired.png

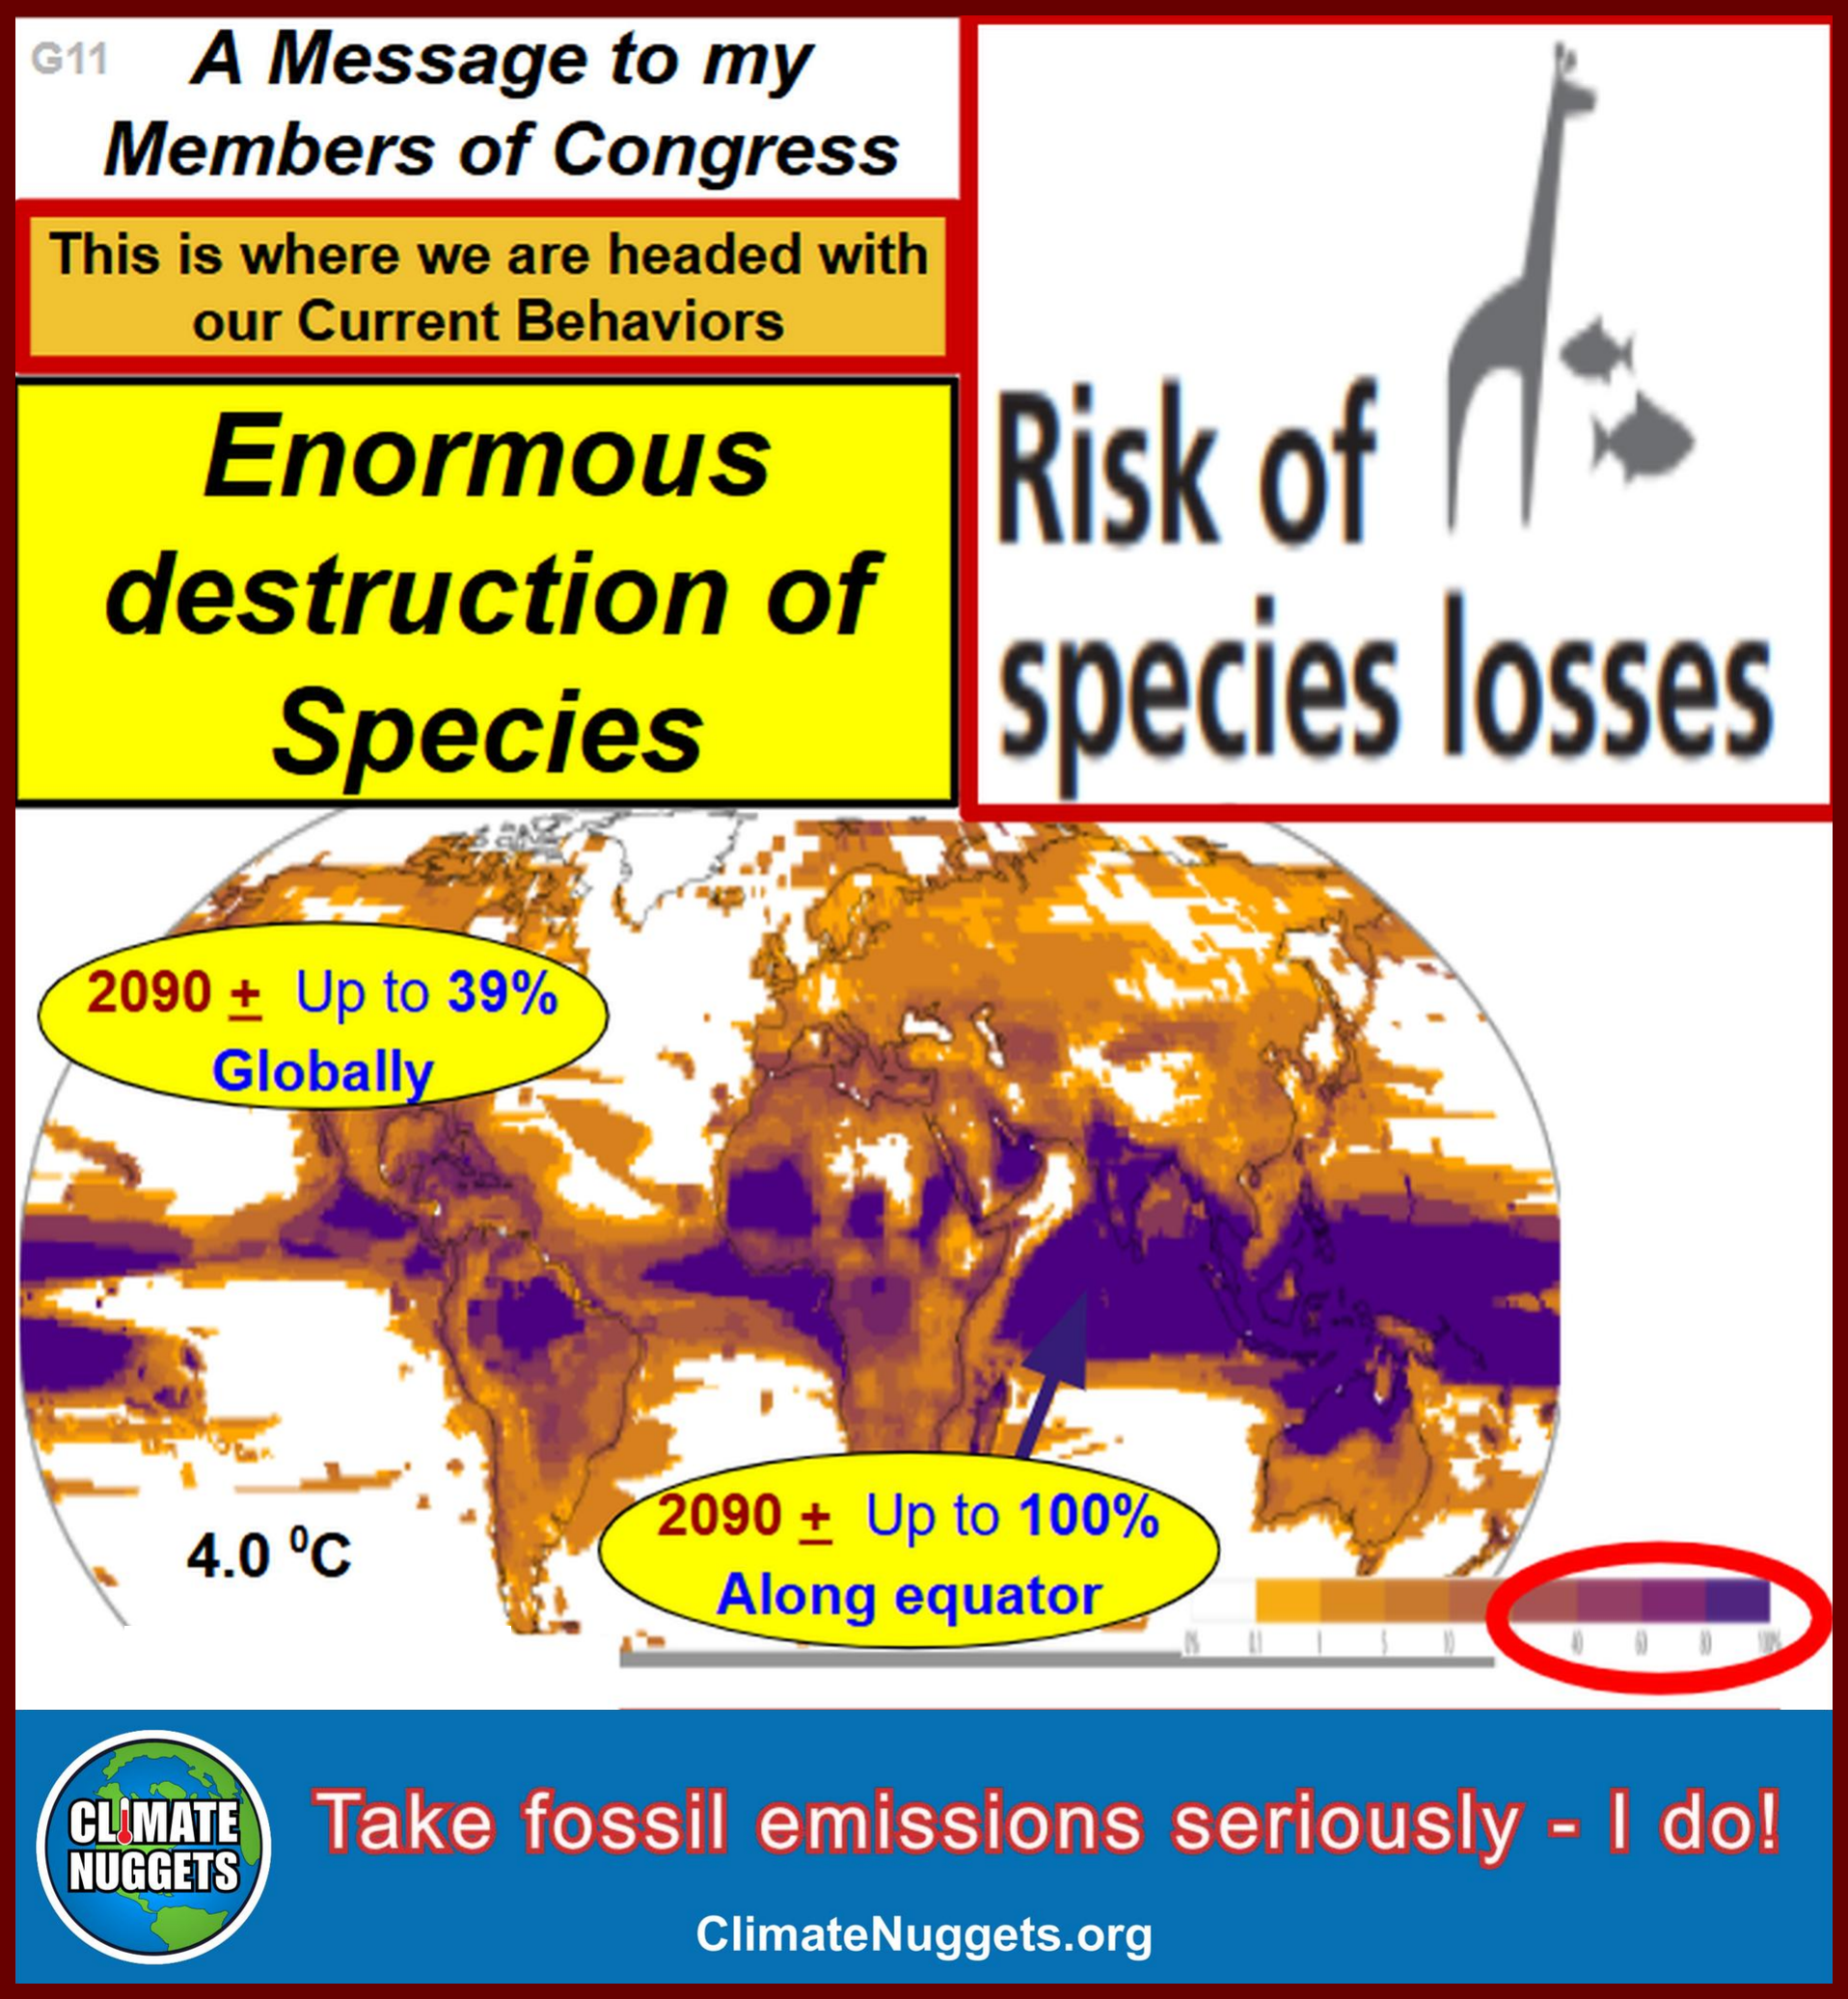
It's easy to neglect that our behaviors (even beyond direct destruction of ecosystems) will lead to massive destruction of species, particularly in the lower-latitudes of our planet.  In addition to human incompatibility from heat/humidity, plants and animals can't live there either, unless we change our trajectory.

Explore Resources for this Nugget:


Intergovernmental Panel on Climate Change:  Summary for Policymakers p14  

Foreword and Preface Technical Summary C.4.1, C.3.1


Foreword and Preface Technical Summary C.3.3, C.6.5, SYN3.2

Foreword and Preface Technical Summary SYN3.1.2


Summary for Policymakers p14


IPCC: CLIMATE CHANGE 2023 p.22

Climate Nuggets: Timing and Impacts Study

Climate Nuggets: Study:  Emissions Goals for the US

Climate Nuggets Study:  Climate Science and Likely Futures - in Graphics  A Global Perspective

G12

G12 — Societal Disruption Will Become Global on Our Trajectory
G12_repaired.png

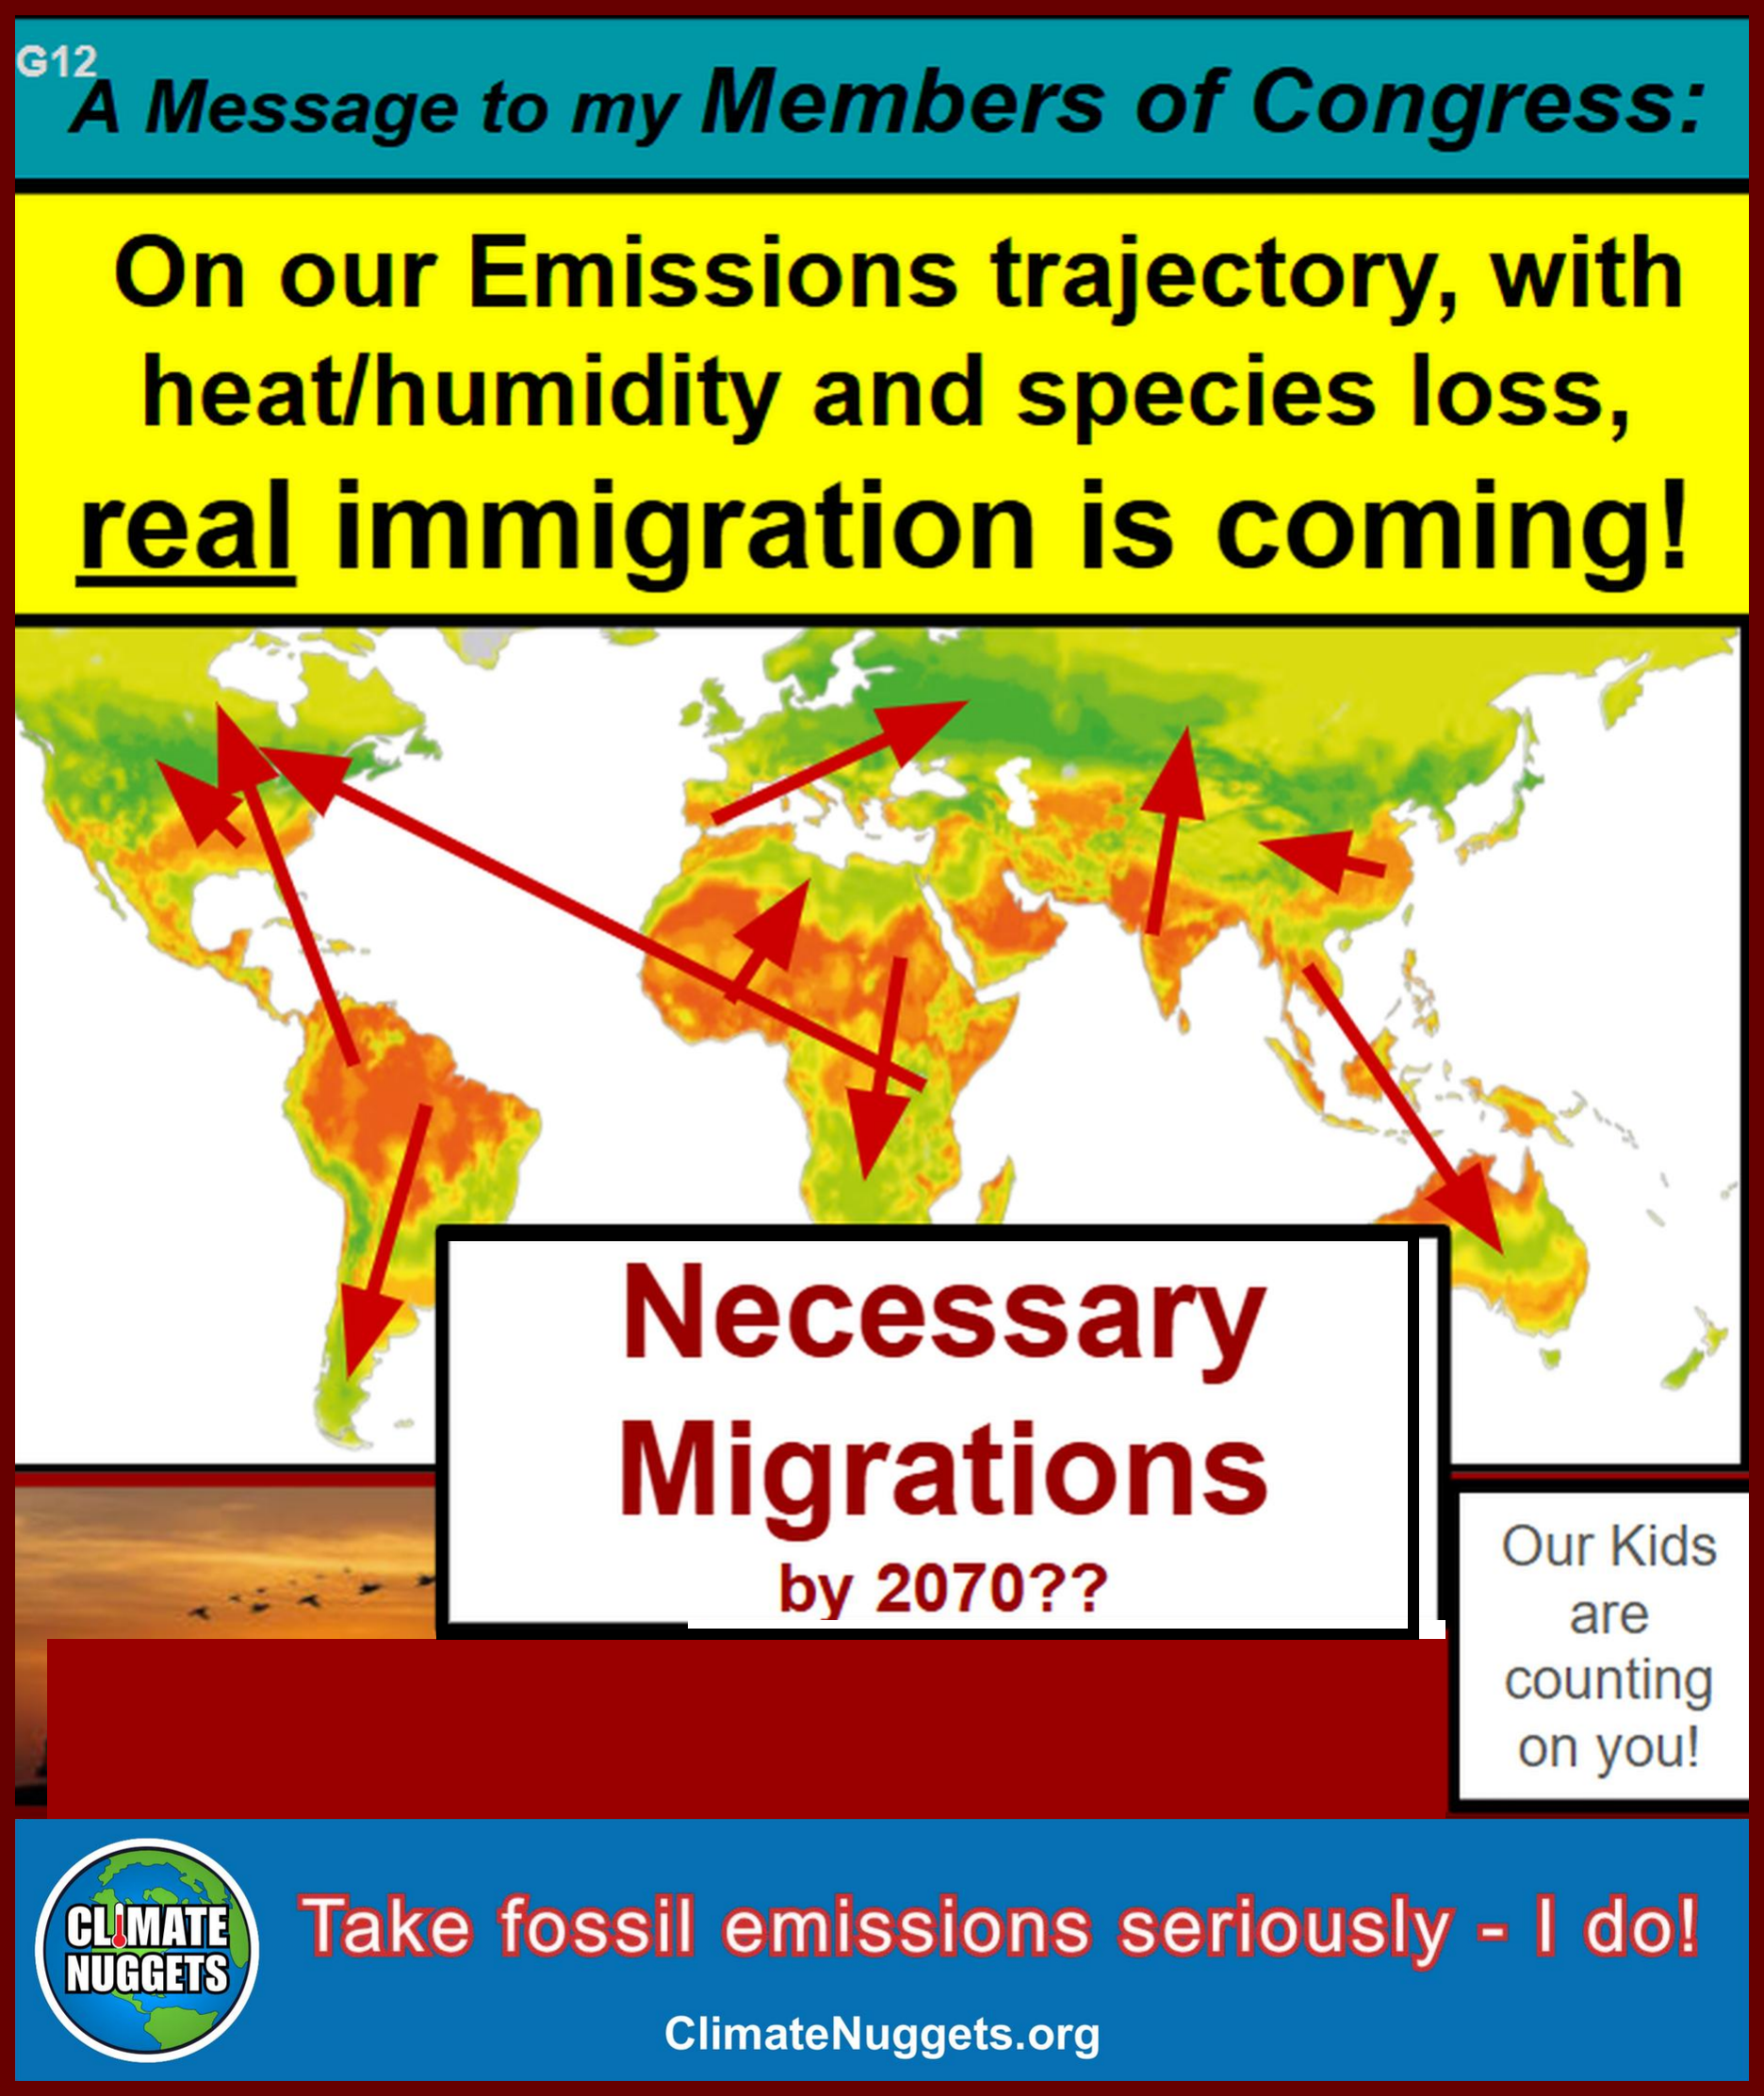
On our current emissions trajectory, it will be harder and harder to survive in the low latitudes around the equator, both from direct health impacts from heat/humidity on humans and from species extinctions.  Our assessment is that global migrations and disruptions will happen by mid-century unless we immediately and drastically cut emissions from the use of fossil fuels.

Explore Resources for this Nugget:


Intergovernmental Panel on Climate Change:  

Climate Change 2022: Impacts, Adaptation and Vulnerability  Figure A1.28
 

Climate Nuggets: Timing and Impacts Study

Climate Nuggets: Study:  Emissions Goals for the US

Climate Nuggets Study:  Climate Science and Likely Futures - in Graphics  A Global Perspective

G13

G13 — Uninhabitable Regions Are Real and Expanding
G13_repaired.png

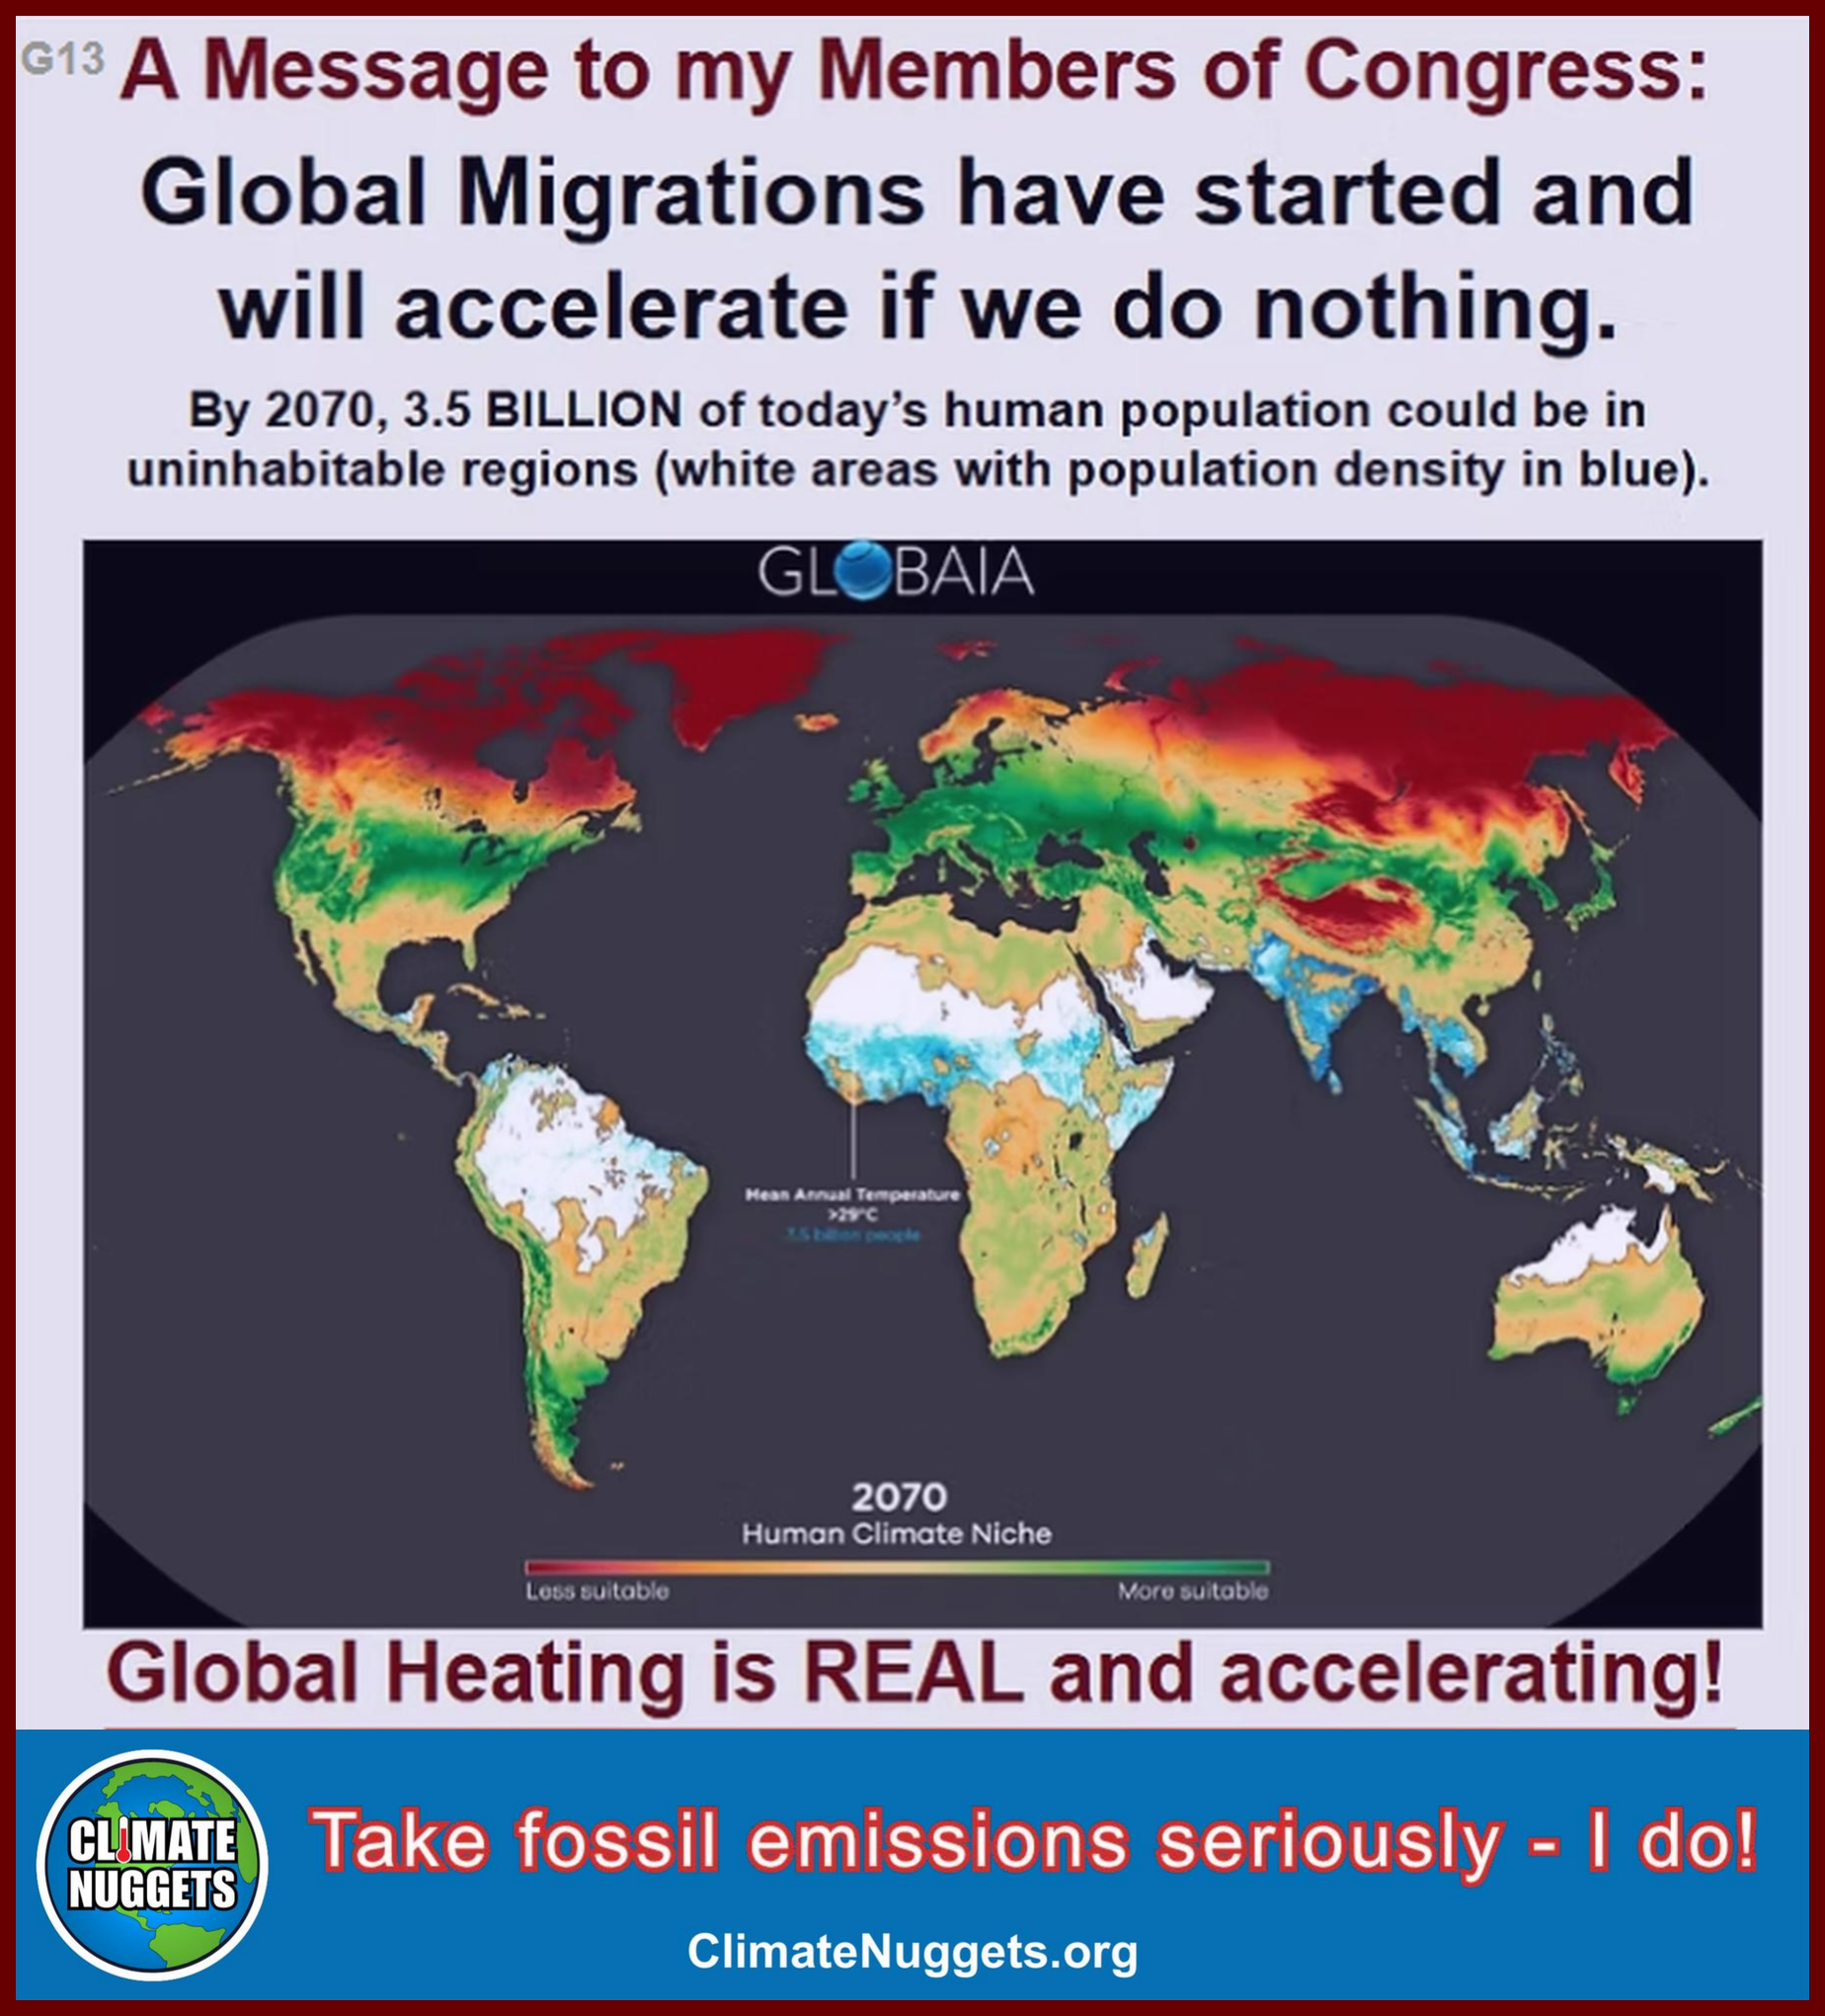
Humans have always thrived best in the "Human Climate Niches" depicted in Globaia.  Those regions have already started to move with global heating.  Billions will need to move away from the white regions this century, on our current trajectory.

Explore Resources for this Nugget:


Globaia:  Human Climate Niches

Nature:  Quantifying the human cost of global warming

Proceedings of the National Academy of Sciences:  Future of the human climate niche

Climate Nuggets: Timing and Impacts Study

Climate Nuggets: Study:  Emissions Goals for the US

Climate Nuggets Study:  Climate Science and Likely Futures - in Graphics  A Global Perspective

G14

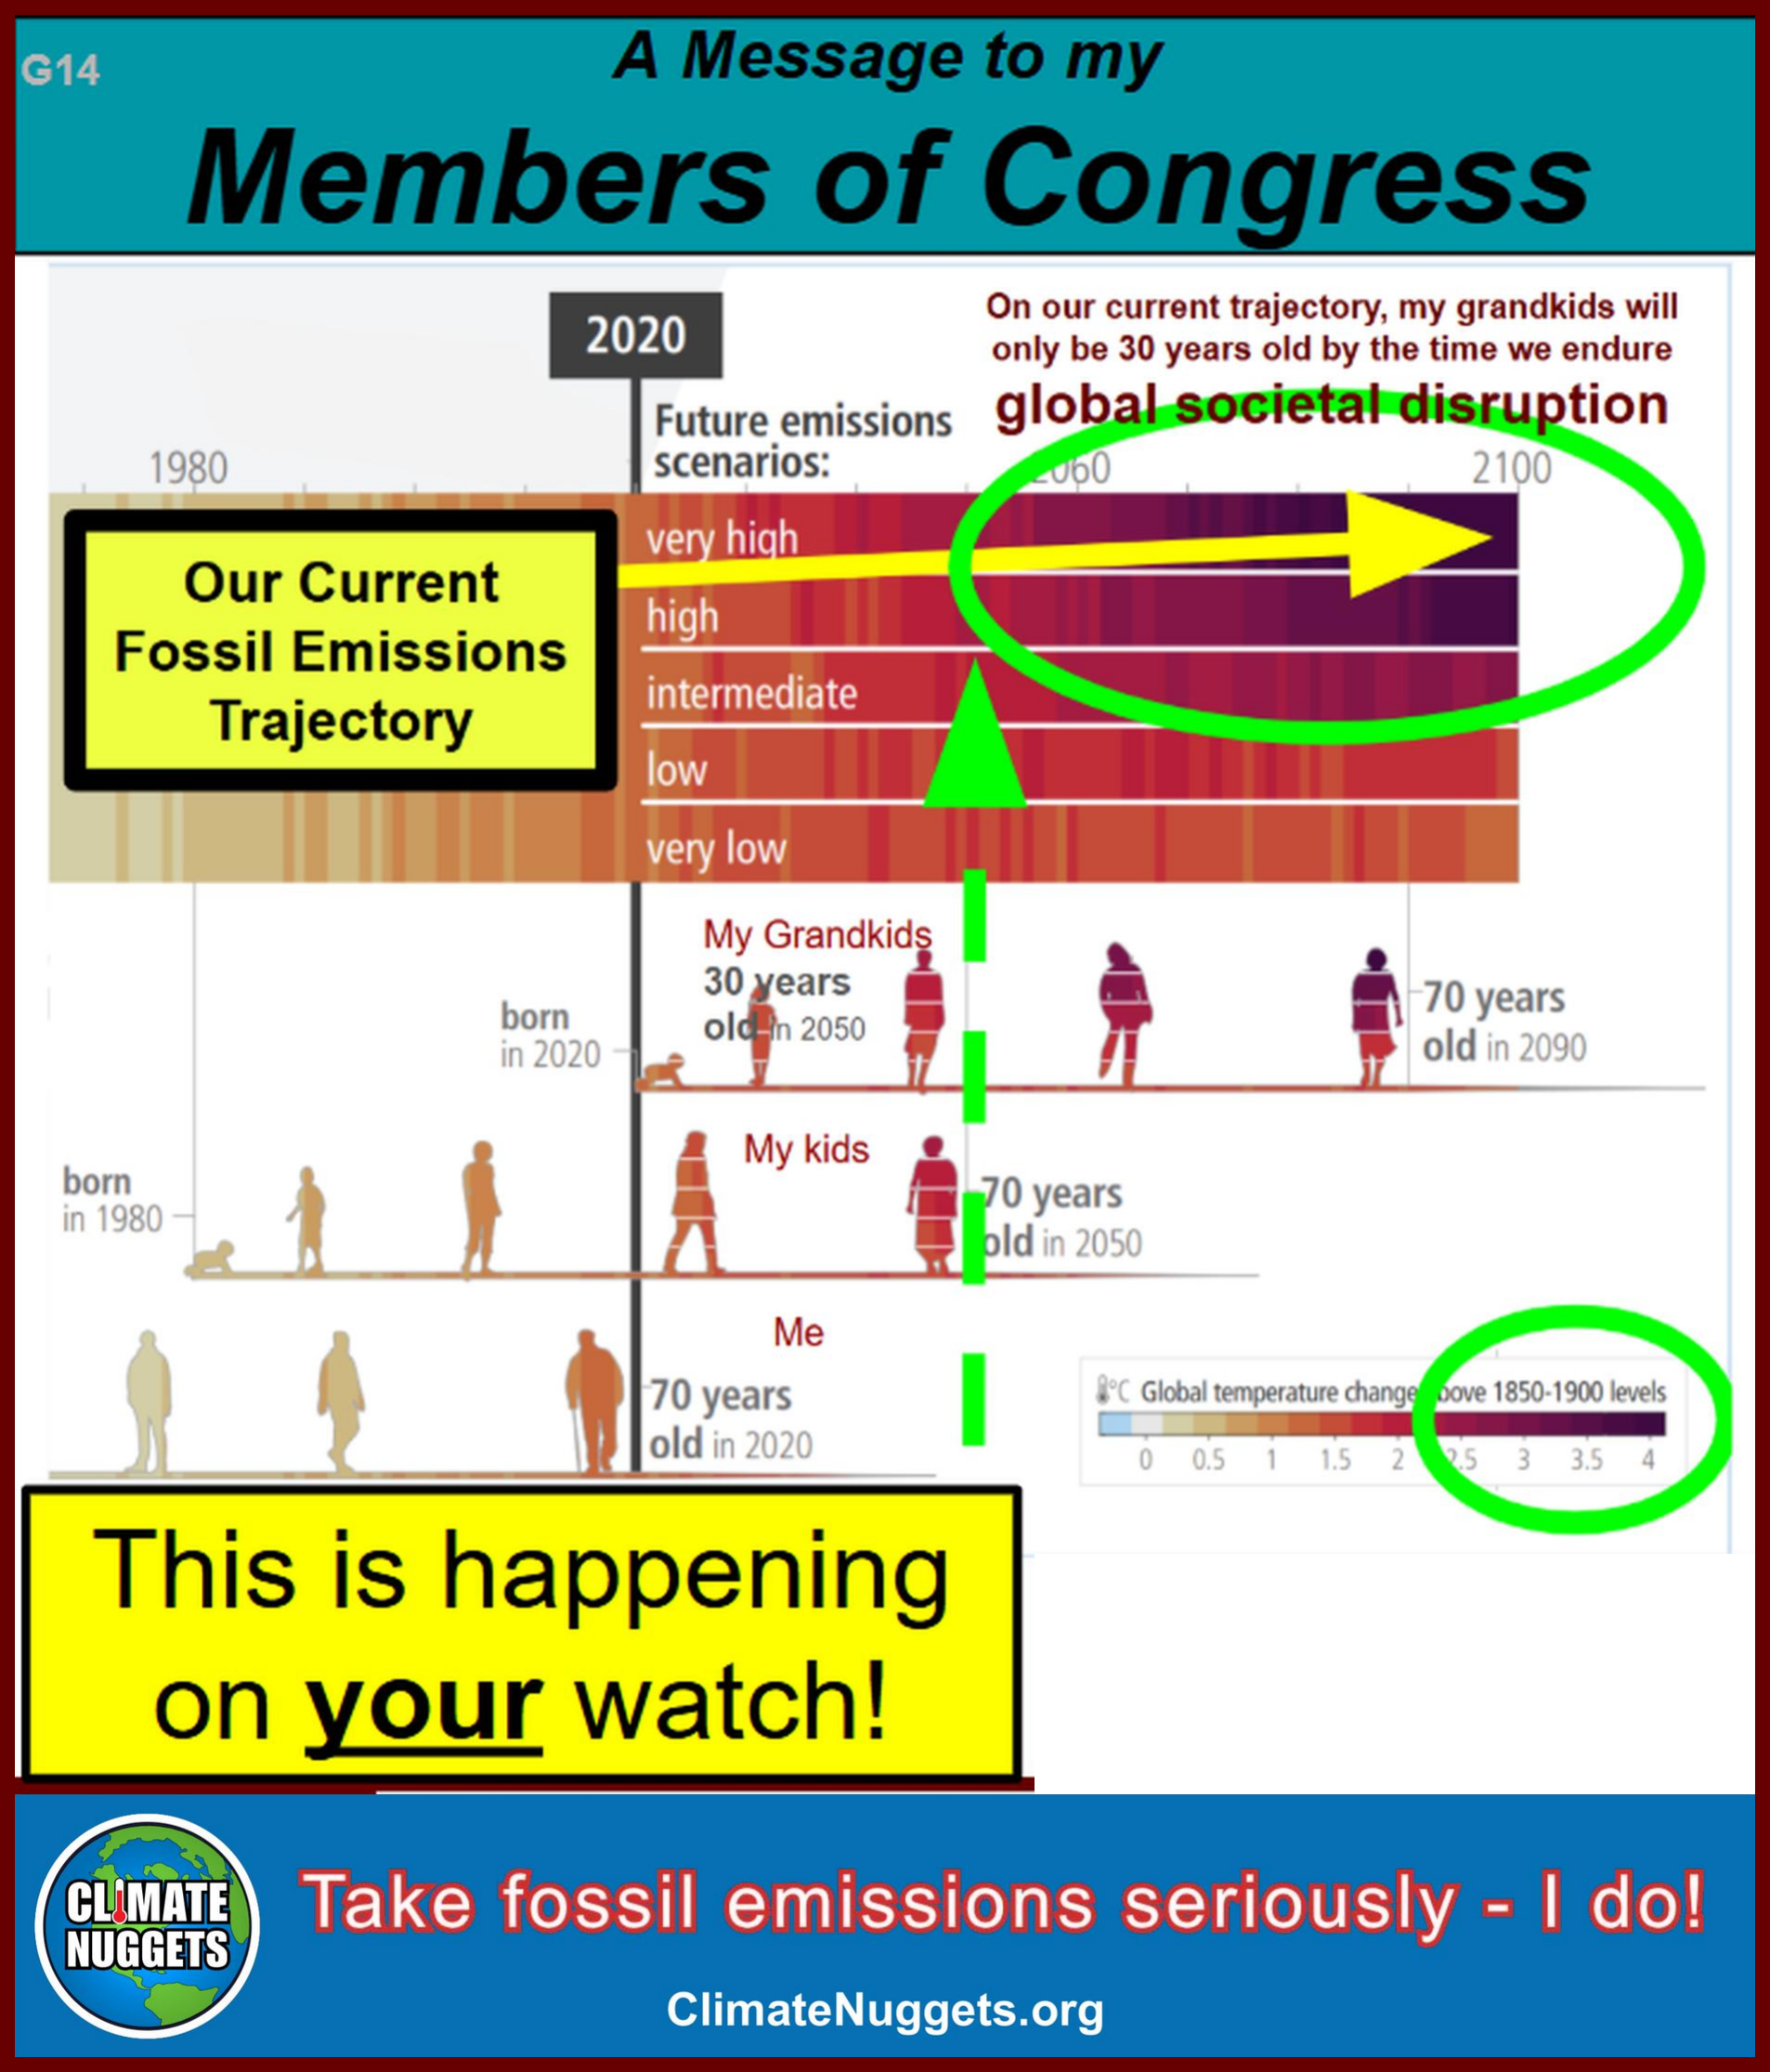
G14 — My Grandkids Will Be Only 30 When Global Societal Disruption Hits
G14_repaired.png

The IPCC has captured the generational impacts in this graphic.  Note that our current fossil emissions trajectory is already putting us in the high to very high range for temperatures and their impacts.  Major disruptions can be expected for a child born today in their early decades of life, unless we drastically and immediately change course.

Explore Resources for this Nugget:

IPCC Intergovernmental Panel on Climate Change: CLIMATE CHANGE 2023 p.13

Climate Nuggets: Timing and Impacts Study

Climate Nuggets: Study:  Emissions Goals for the US

Climate Nuggets Study:  Climate Science and Likely Futures - in Graphics  A Global Perspective

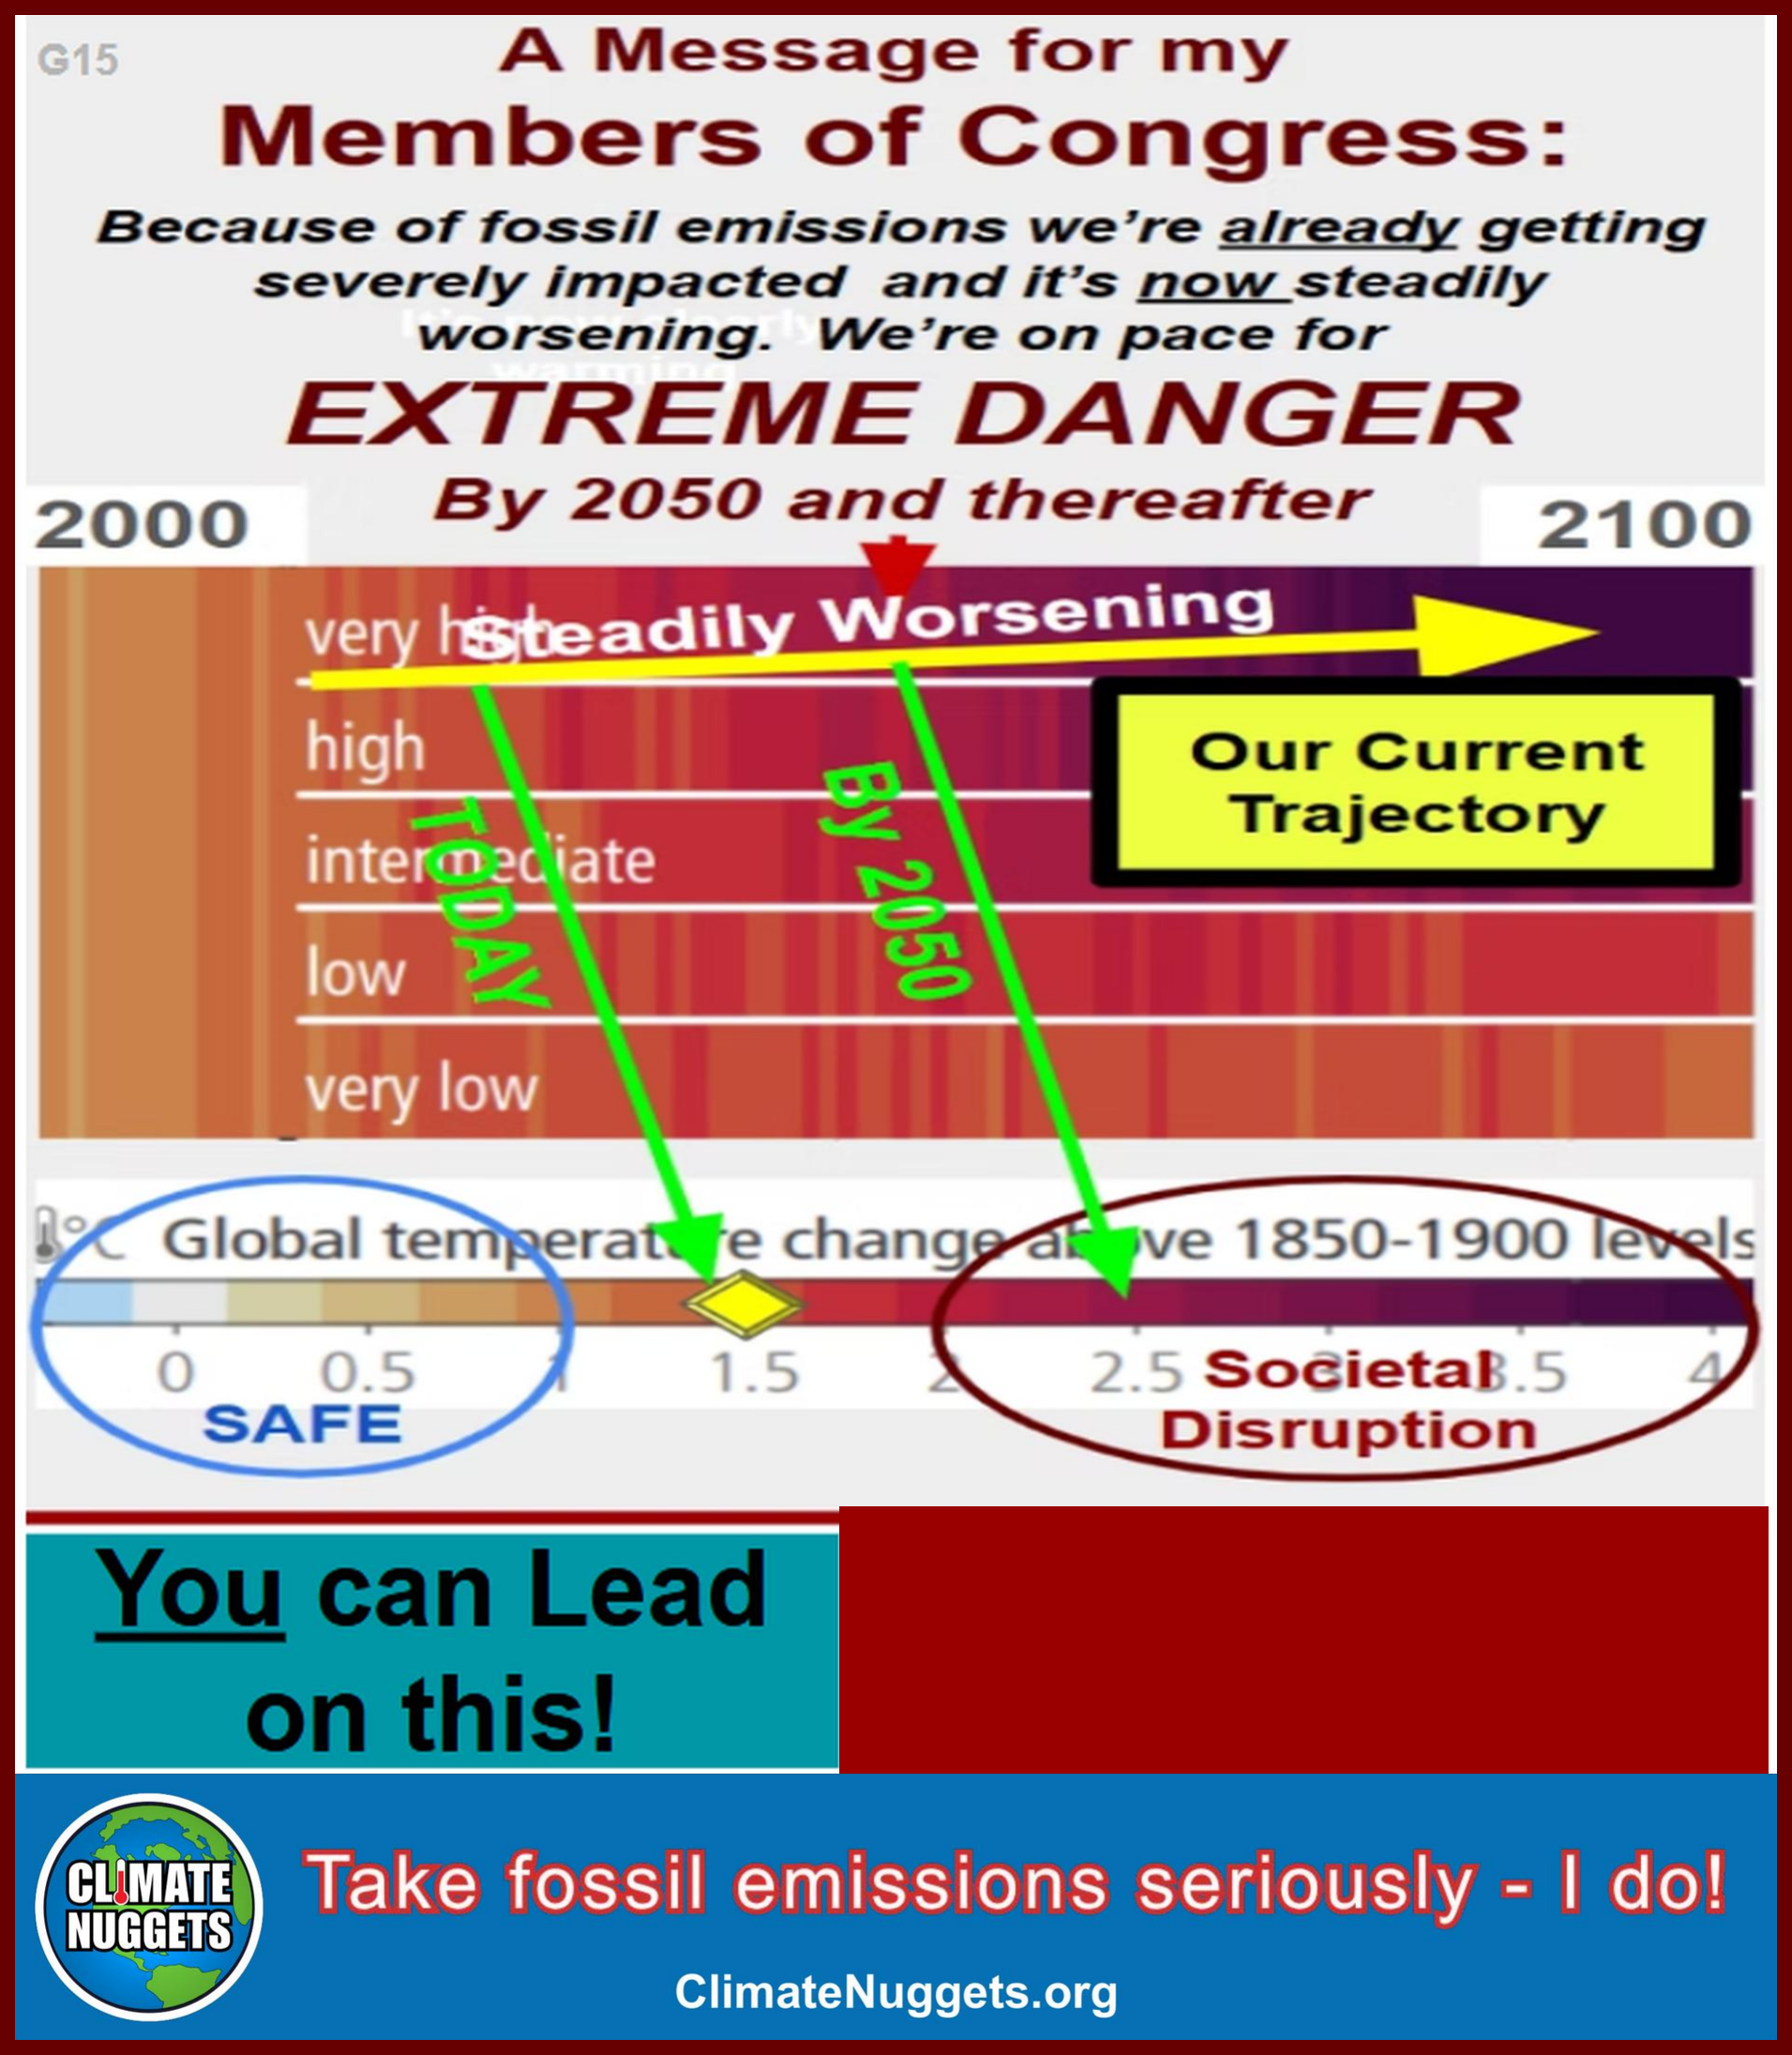
G15 — Extreme Danger by Mid-Century on Our Current Trajectory
G15
G15_repaired.png

This chart shows the region of temperature increases (above 2C) judged as too high for global stability.  We are on the road to major impacts unless we keep the temperature rise down, which requires immediate drastic cuts to fossil emissions.

Explore Resources for this Nugget:

IPCC Intergovernmental Panel on Climate Change: CLIMATE CHANGE 2023 p.13

Climate Nuggets: Timing and Impacts Study

Climate Nuggets: Study:  Emissions Goals for the US

Climate Nuggets Study:  Climate Science and Likely Futures - in Graphics  A Global Perspective

G16

G16 — Heat Risk to Pregnancies Has Doubled

G16_repaired.png

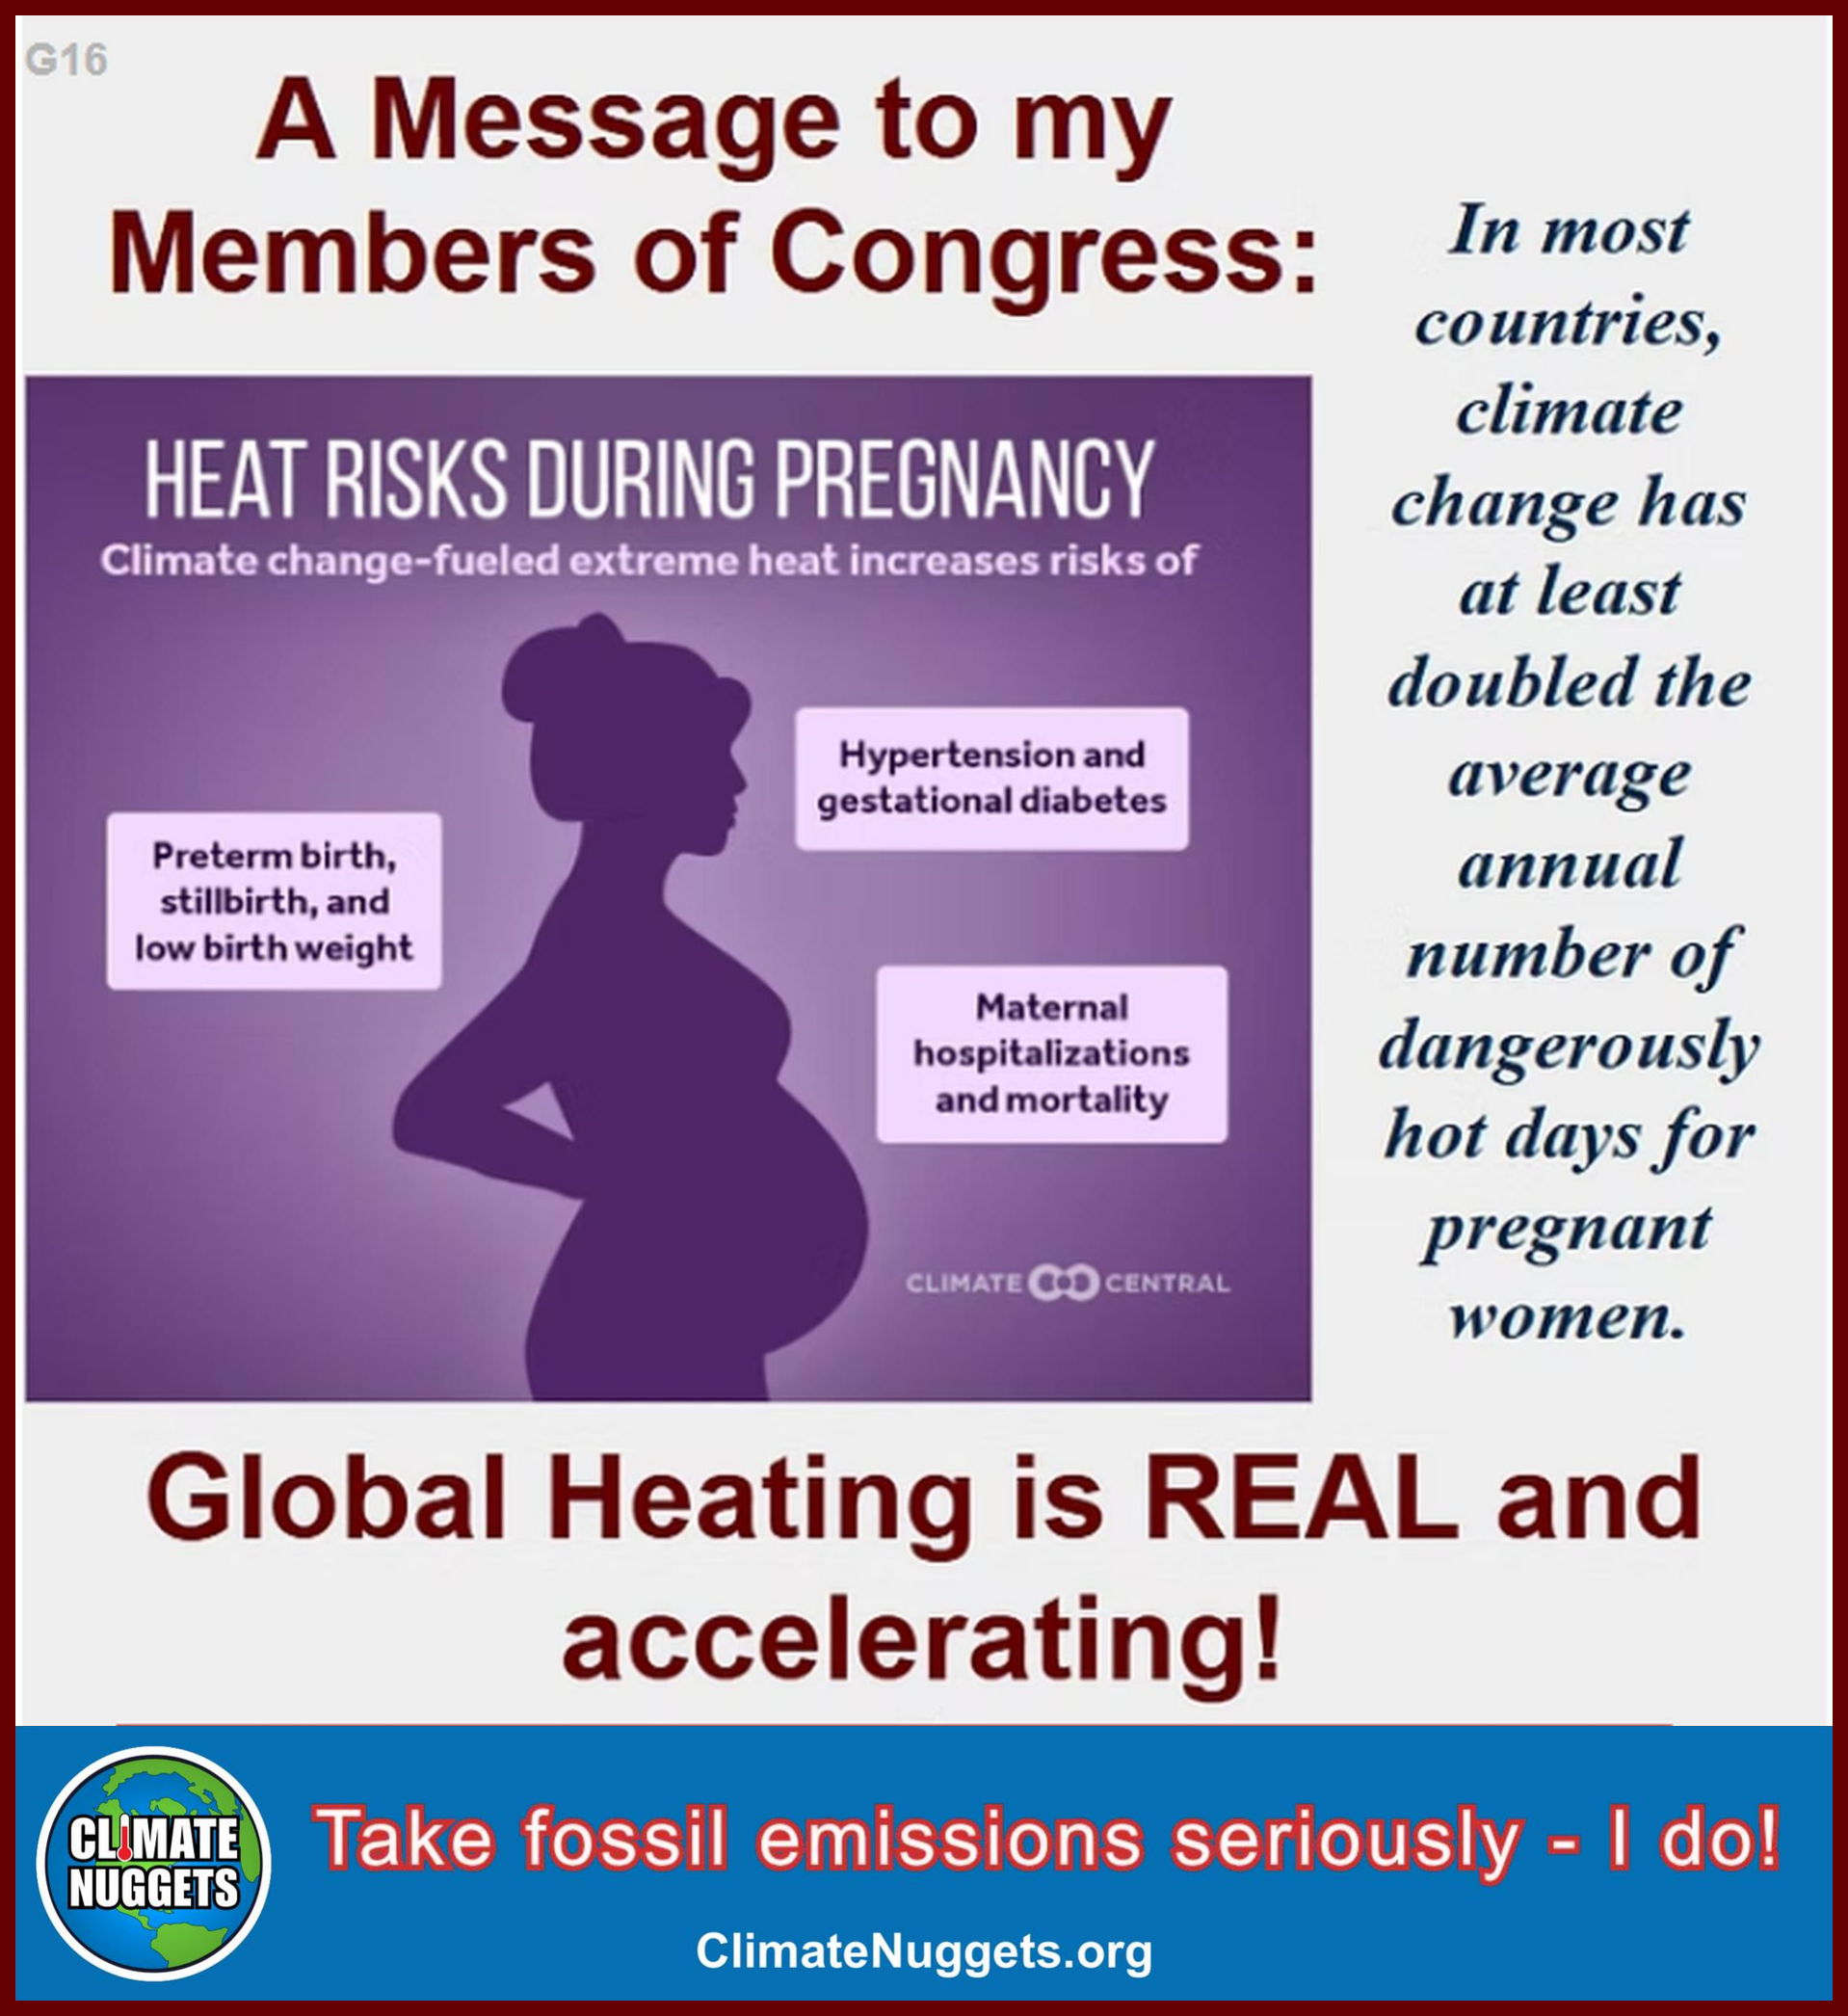
Global heating takes a severe physical health toll on pregnancies, both on the fetus and the mother.  Already high-risk days have increased by as much as 30 or more in places like Florida.

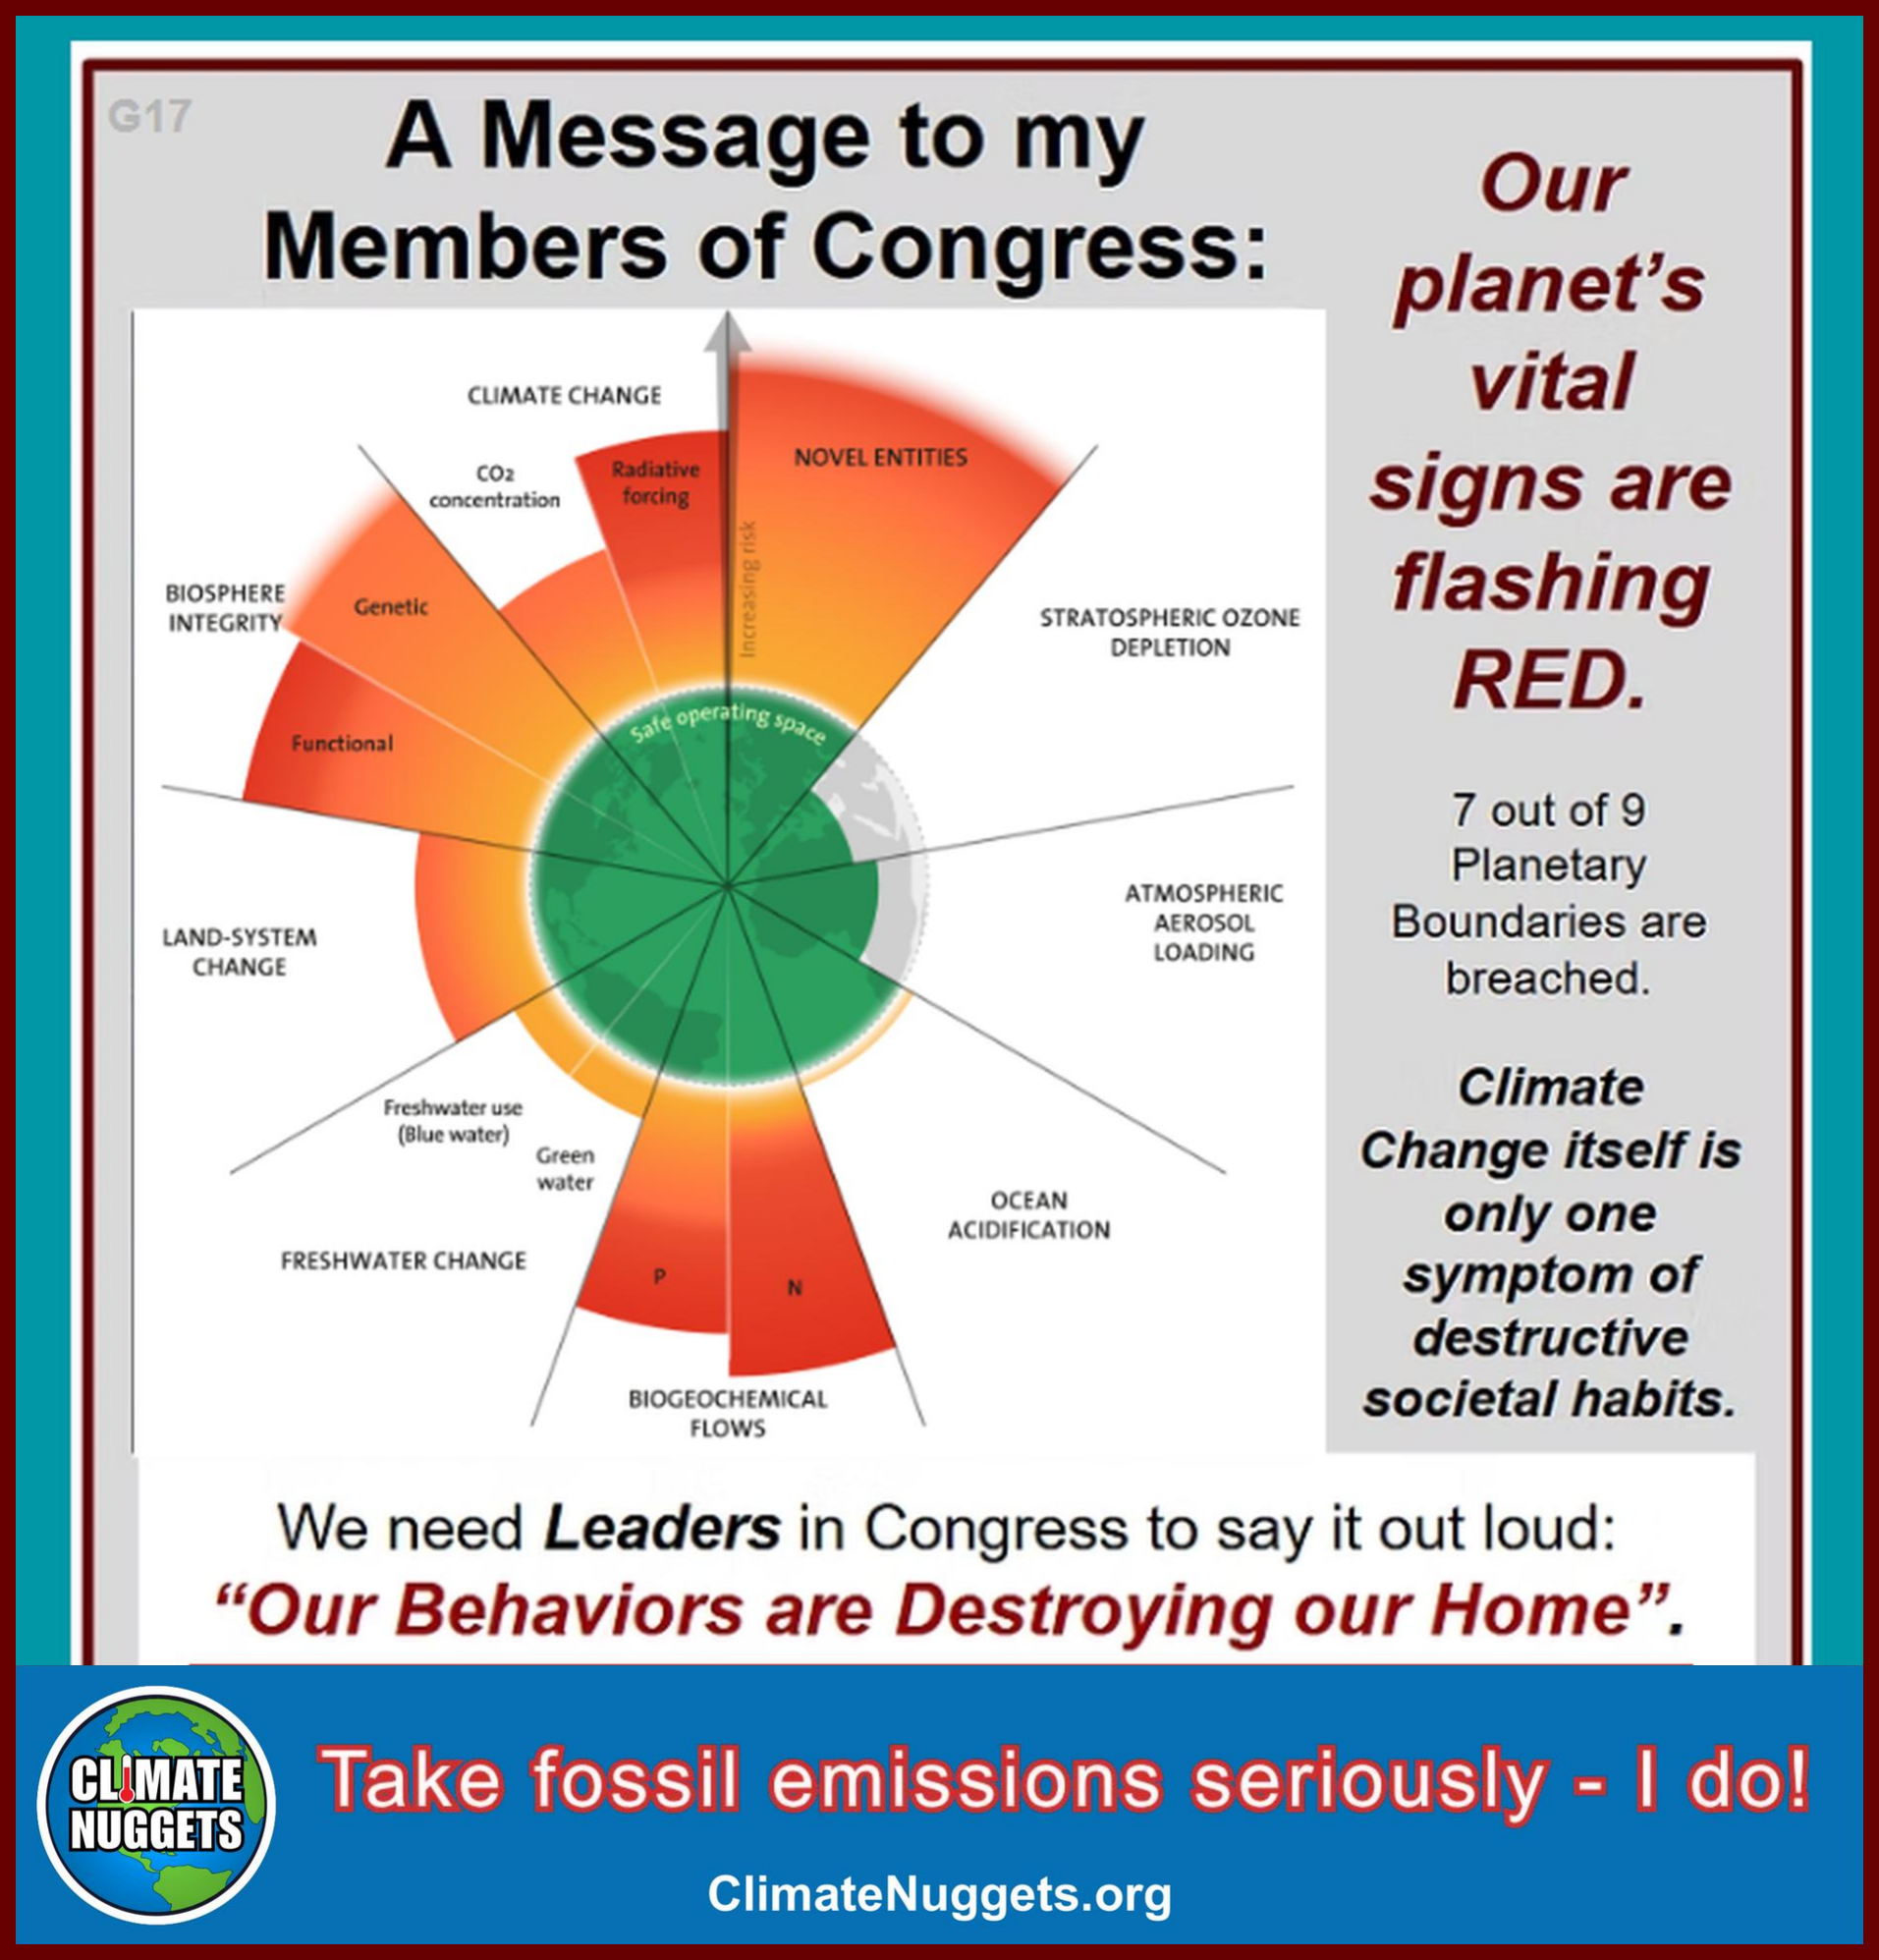
G17 — Our Planet's Vital Signs Are Flashing RED
G17
G17_repaired.png

It's become increasingly obvious that our  behaviors in many fronts are more than can be sustained by the planet.  The Planetary Boundaries project is quantifying the impacts and climate change has put us far out into the danger zone.  Fossil emissions are the reason.

G18

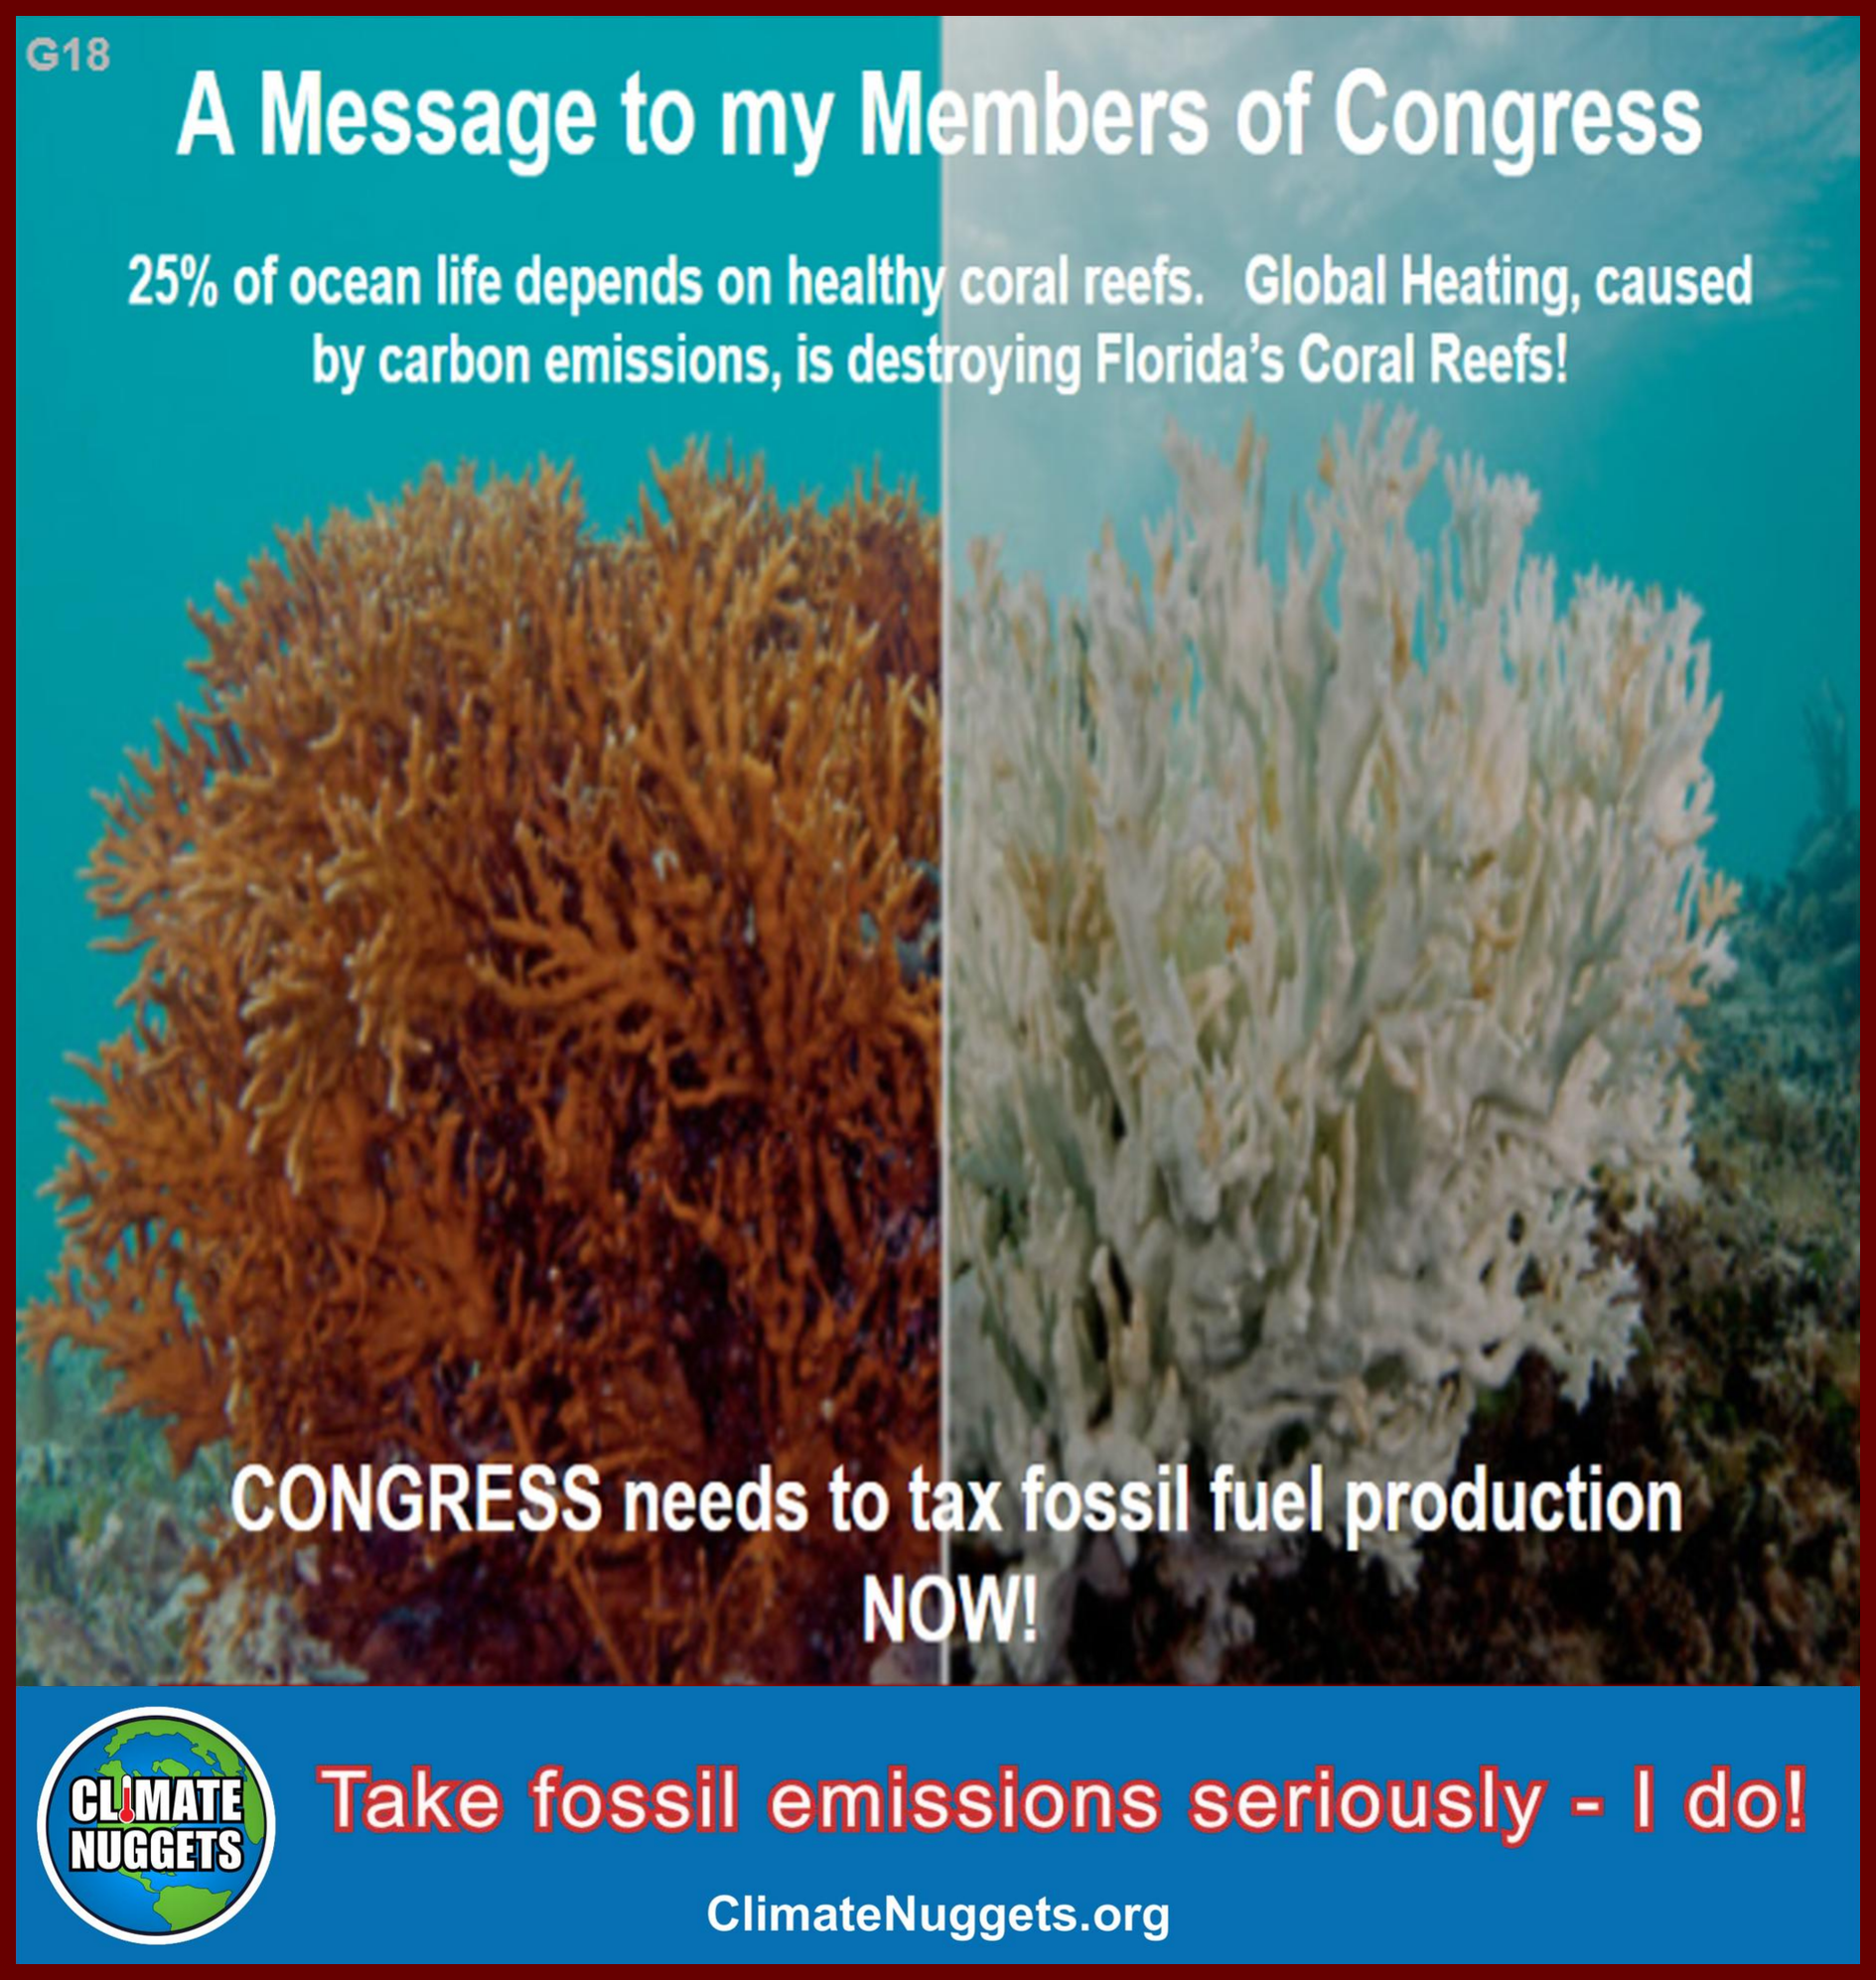
G18 — Global Heating Is Destroying Our Coral Reefs
G18_repaired.png

We appear to have crossed our first major tipping point - the inevitable destruction of the planet's coral reefs because of global heating.  the warming waters and acidification are causing widespread destruction already.  Even urgent cuts in emissions likely won't recover these critical resources.

G19 — Carbon Inequality Kills

G19
G19_repaired.png

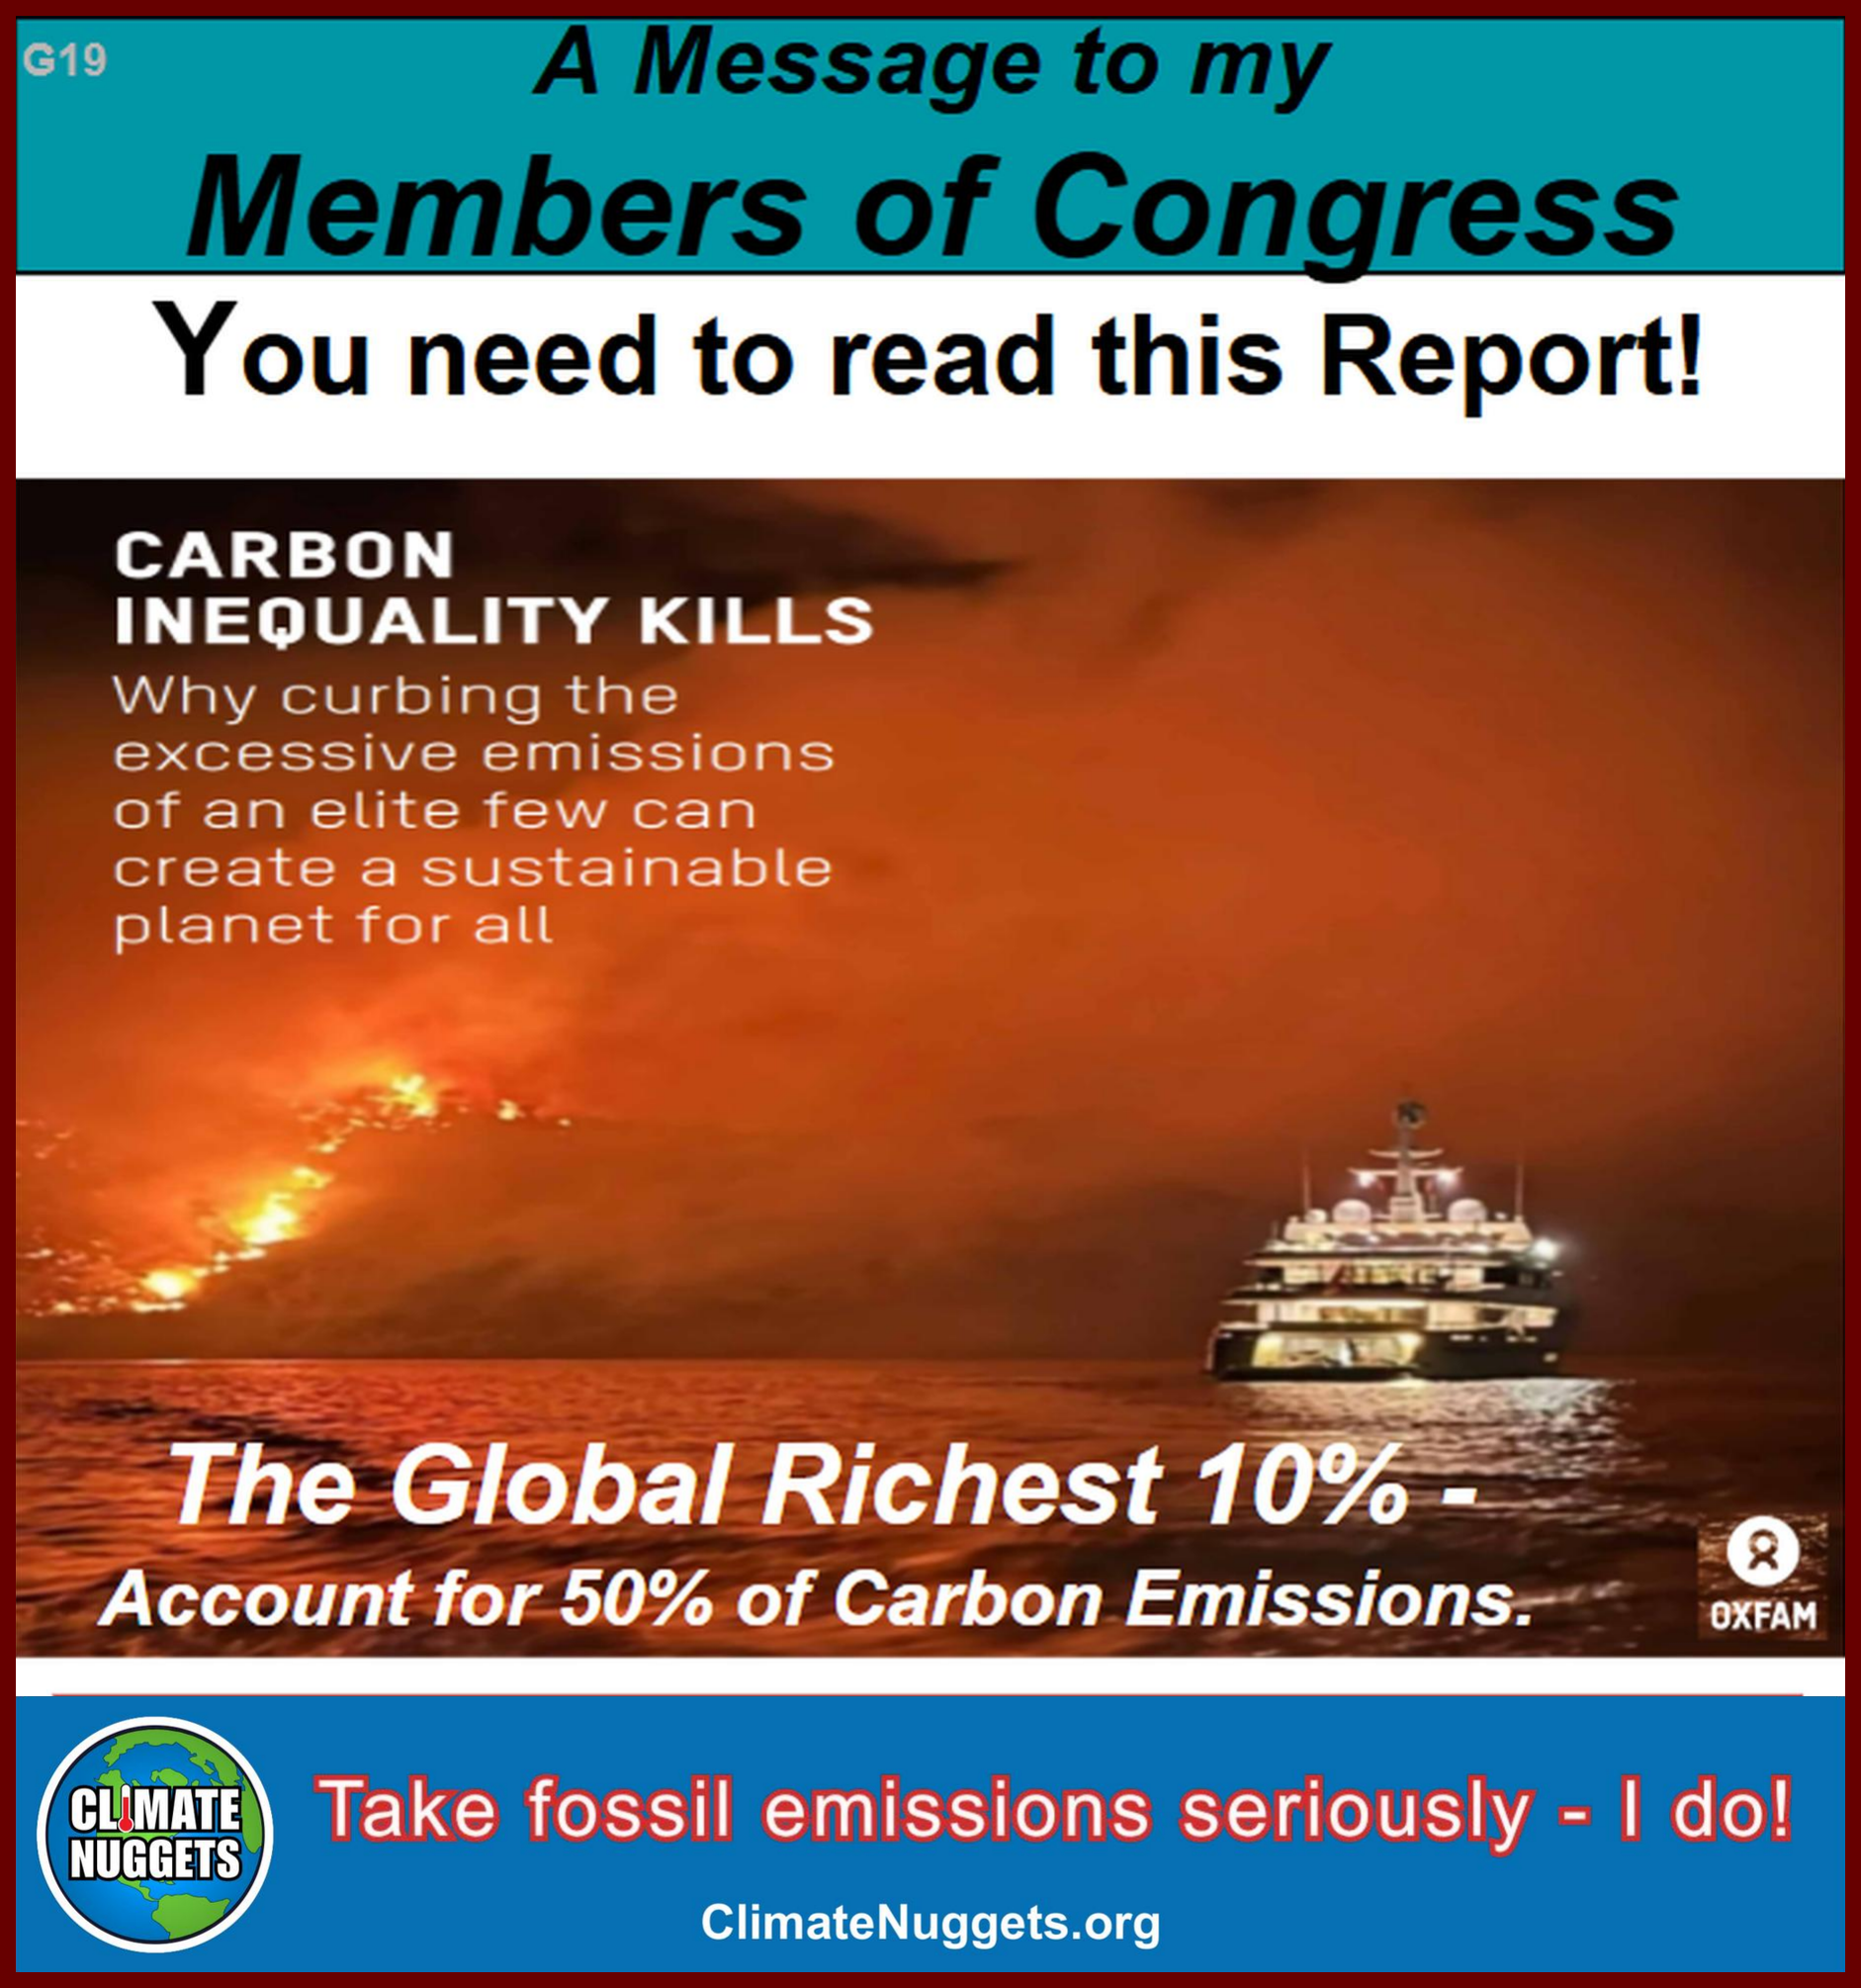
We rarely think about it but the biggest negative impacts on the planet are caused by the behaviors and investments of the most wealthy.  We must bring this to their and society's awareness to influence behaviors and decisions.

Explore Resources for this Nugget:  

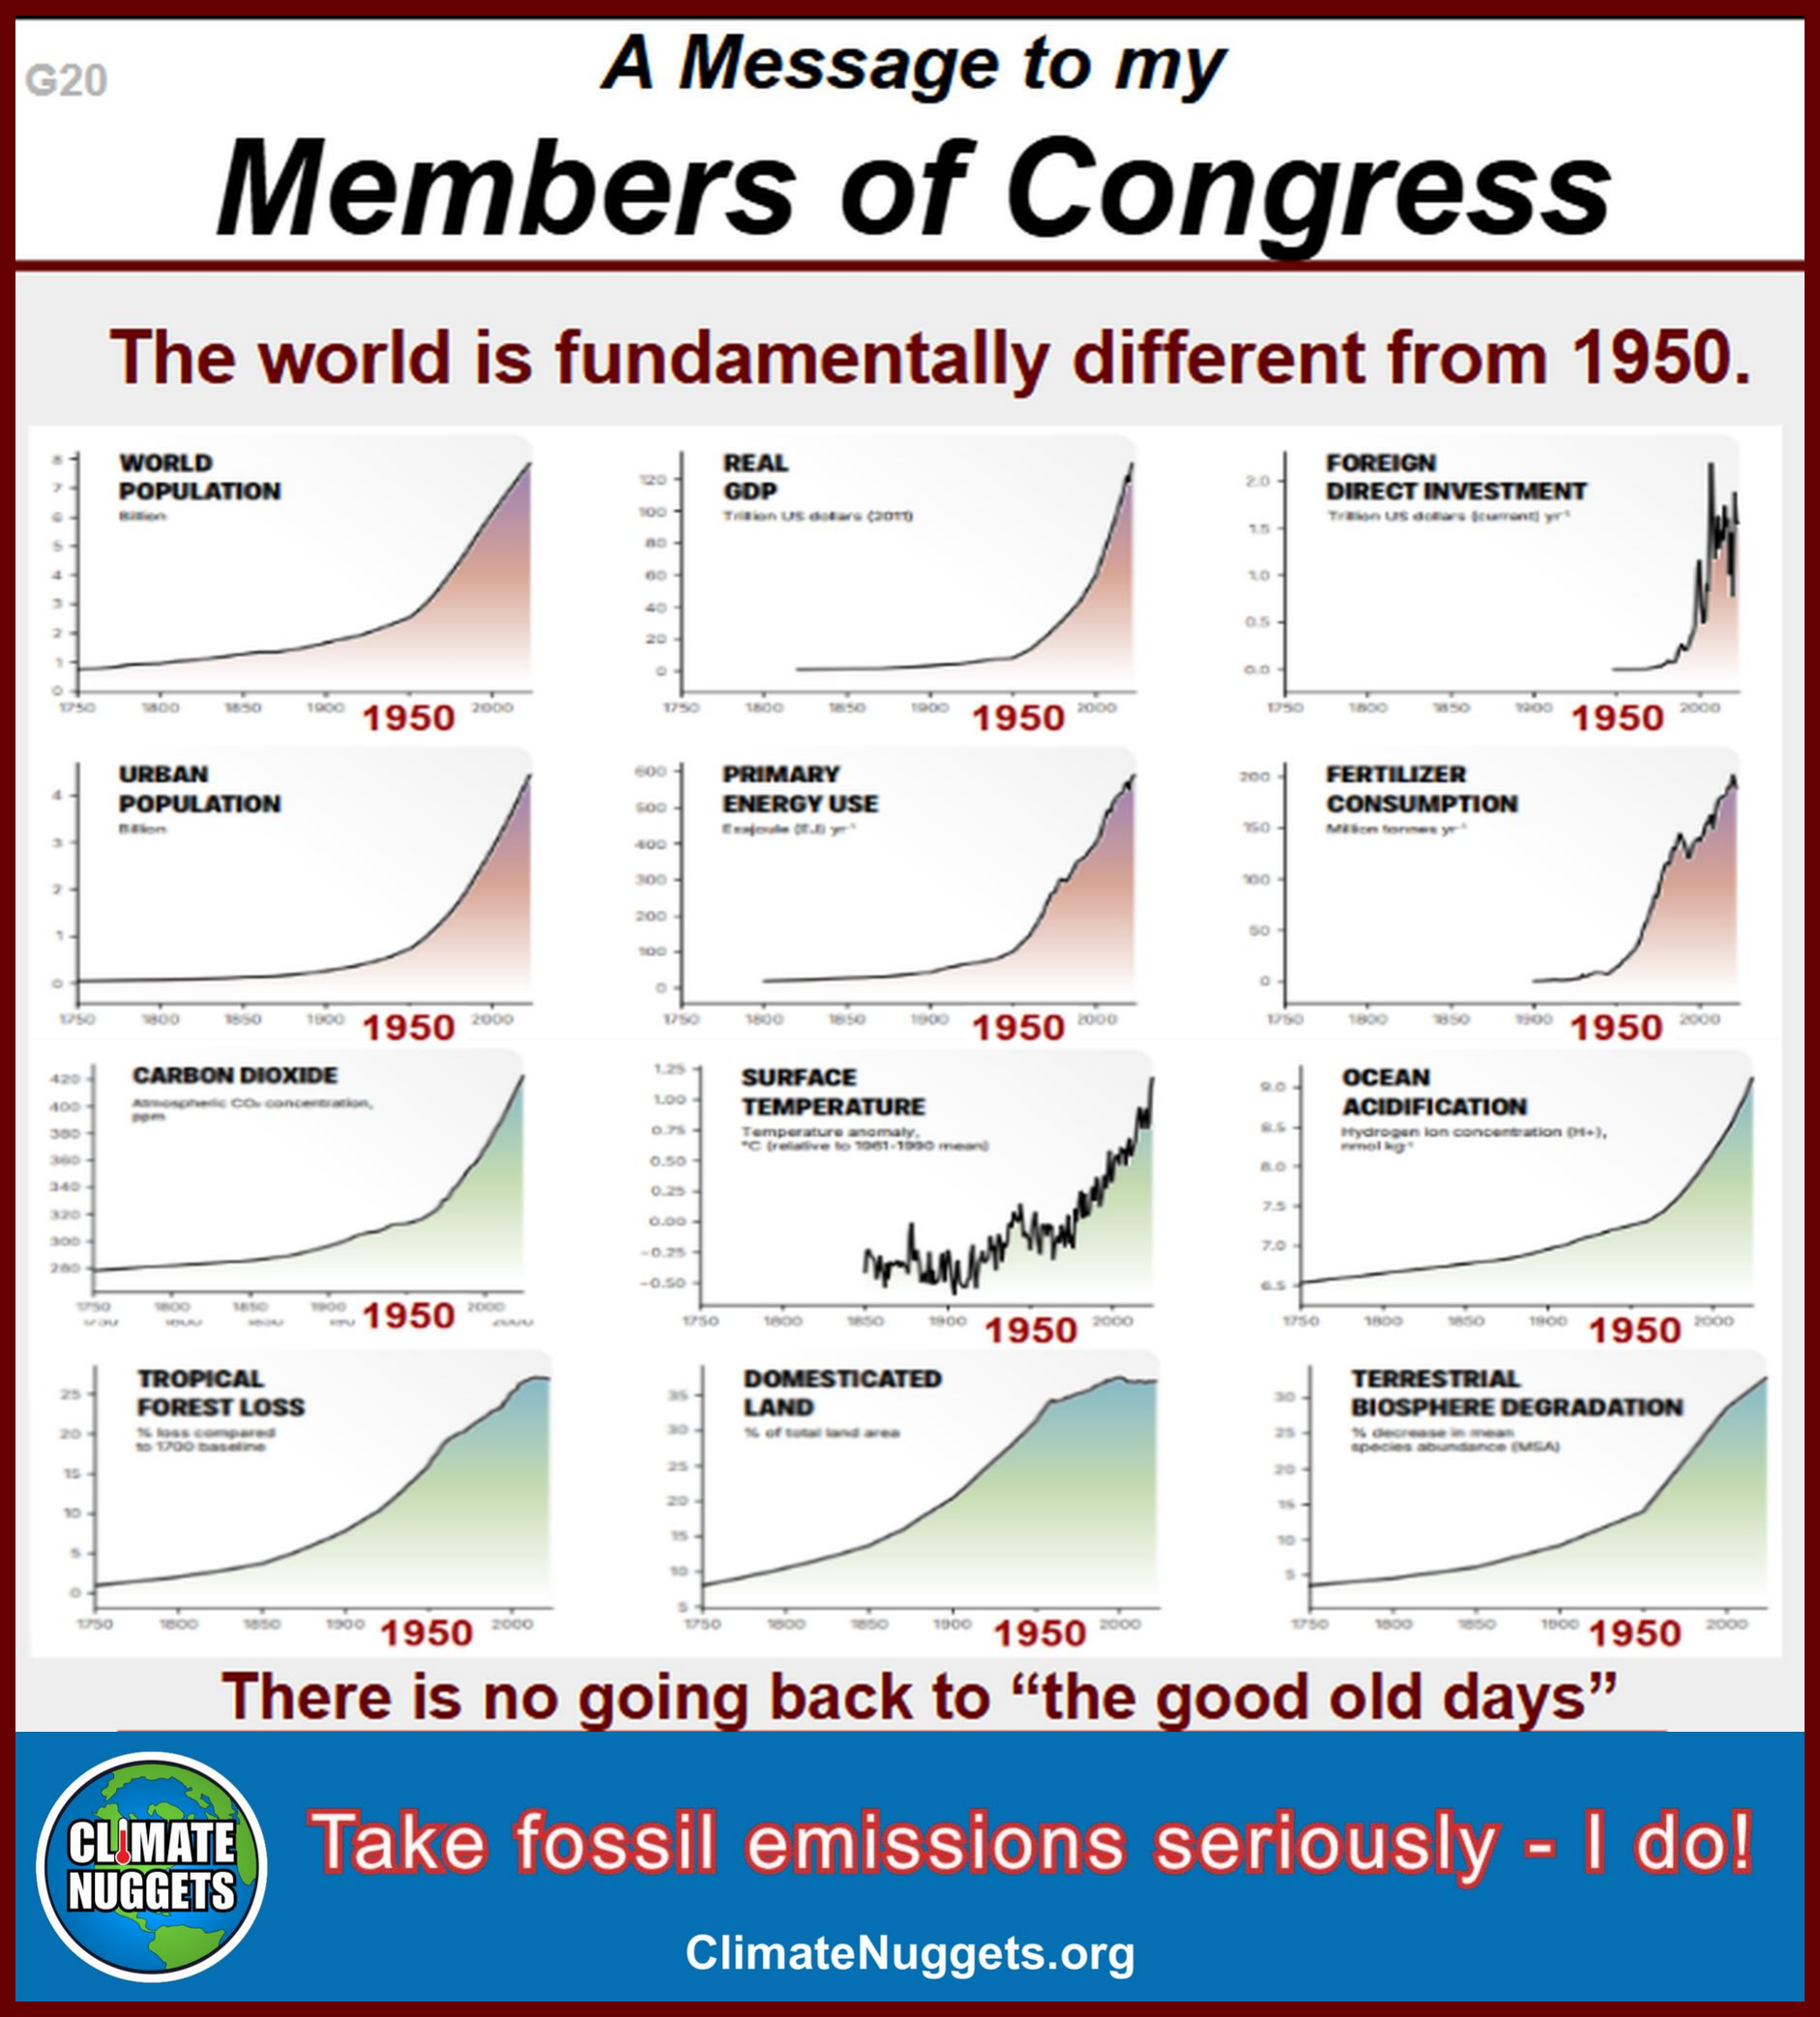
G20 — The World Is Fundamentally Different from 1950 — We Can't Go Back
G20
G20_repaired.png

Wake up and notice that the world has fundamentally changed since 1950 - and we have to find totally new ways to deal with our problems.  This includes the realities of global heating and climate change.  We can't go back and the problems are far harder than before.

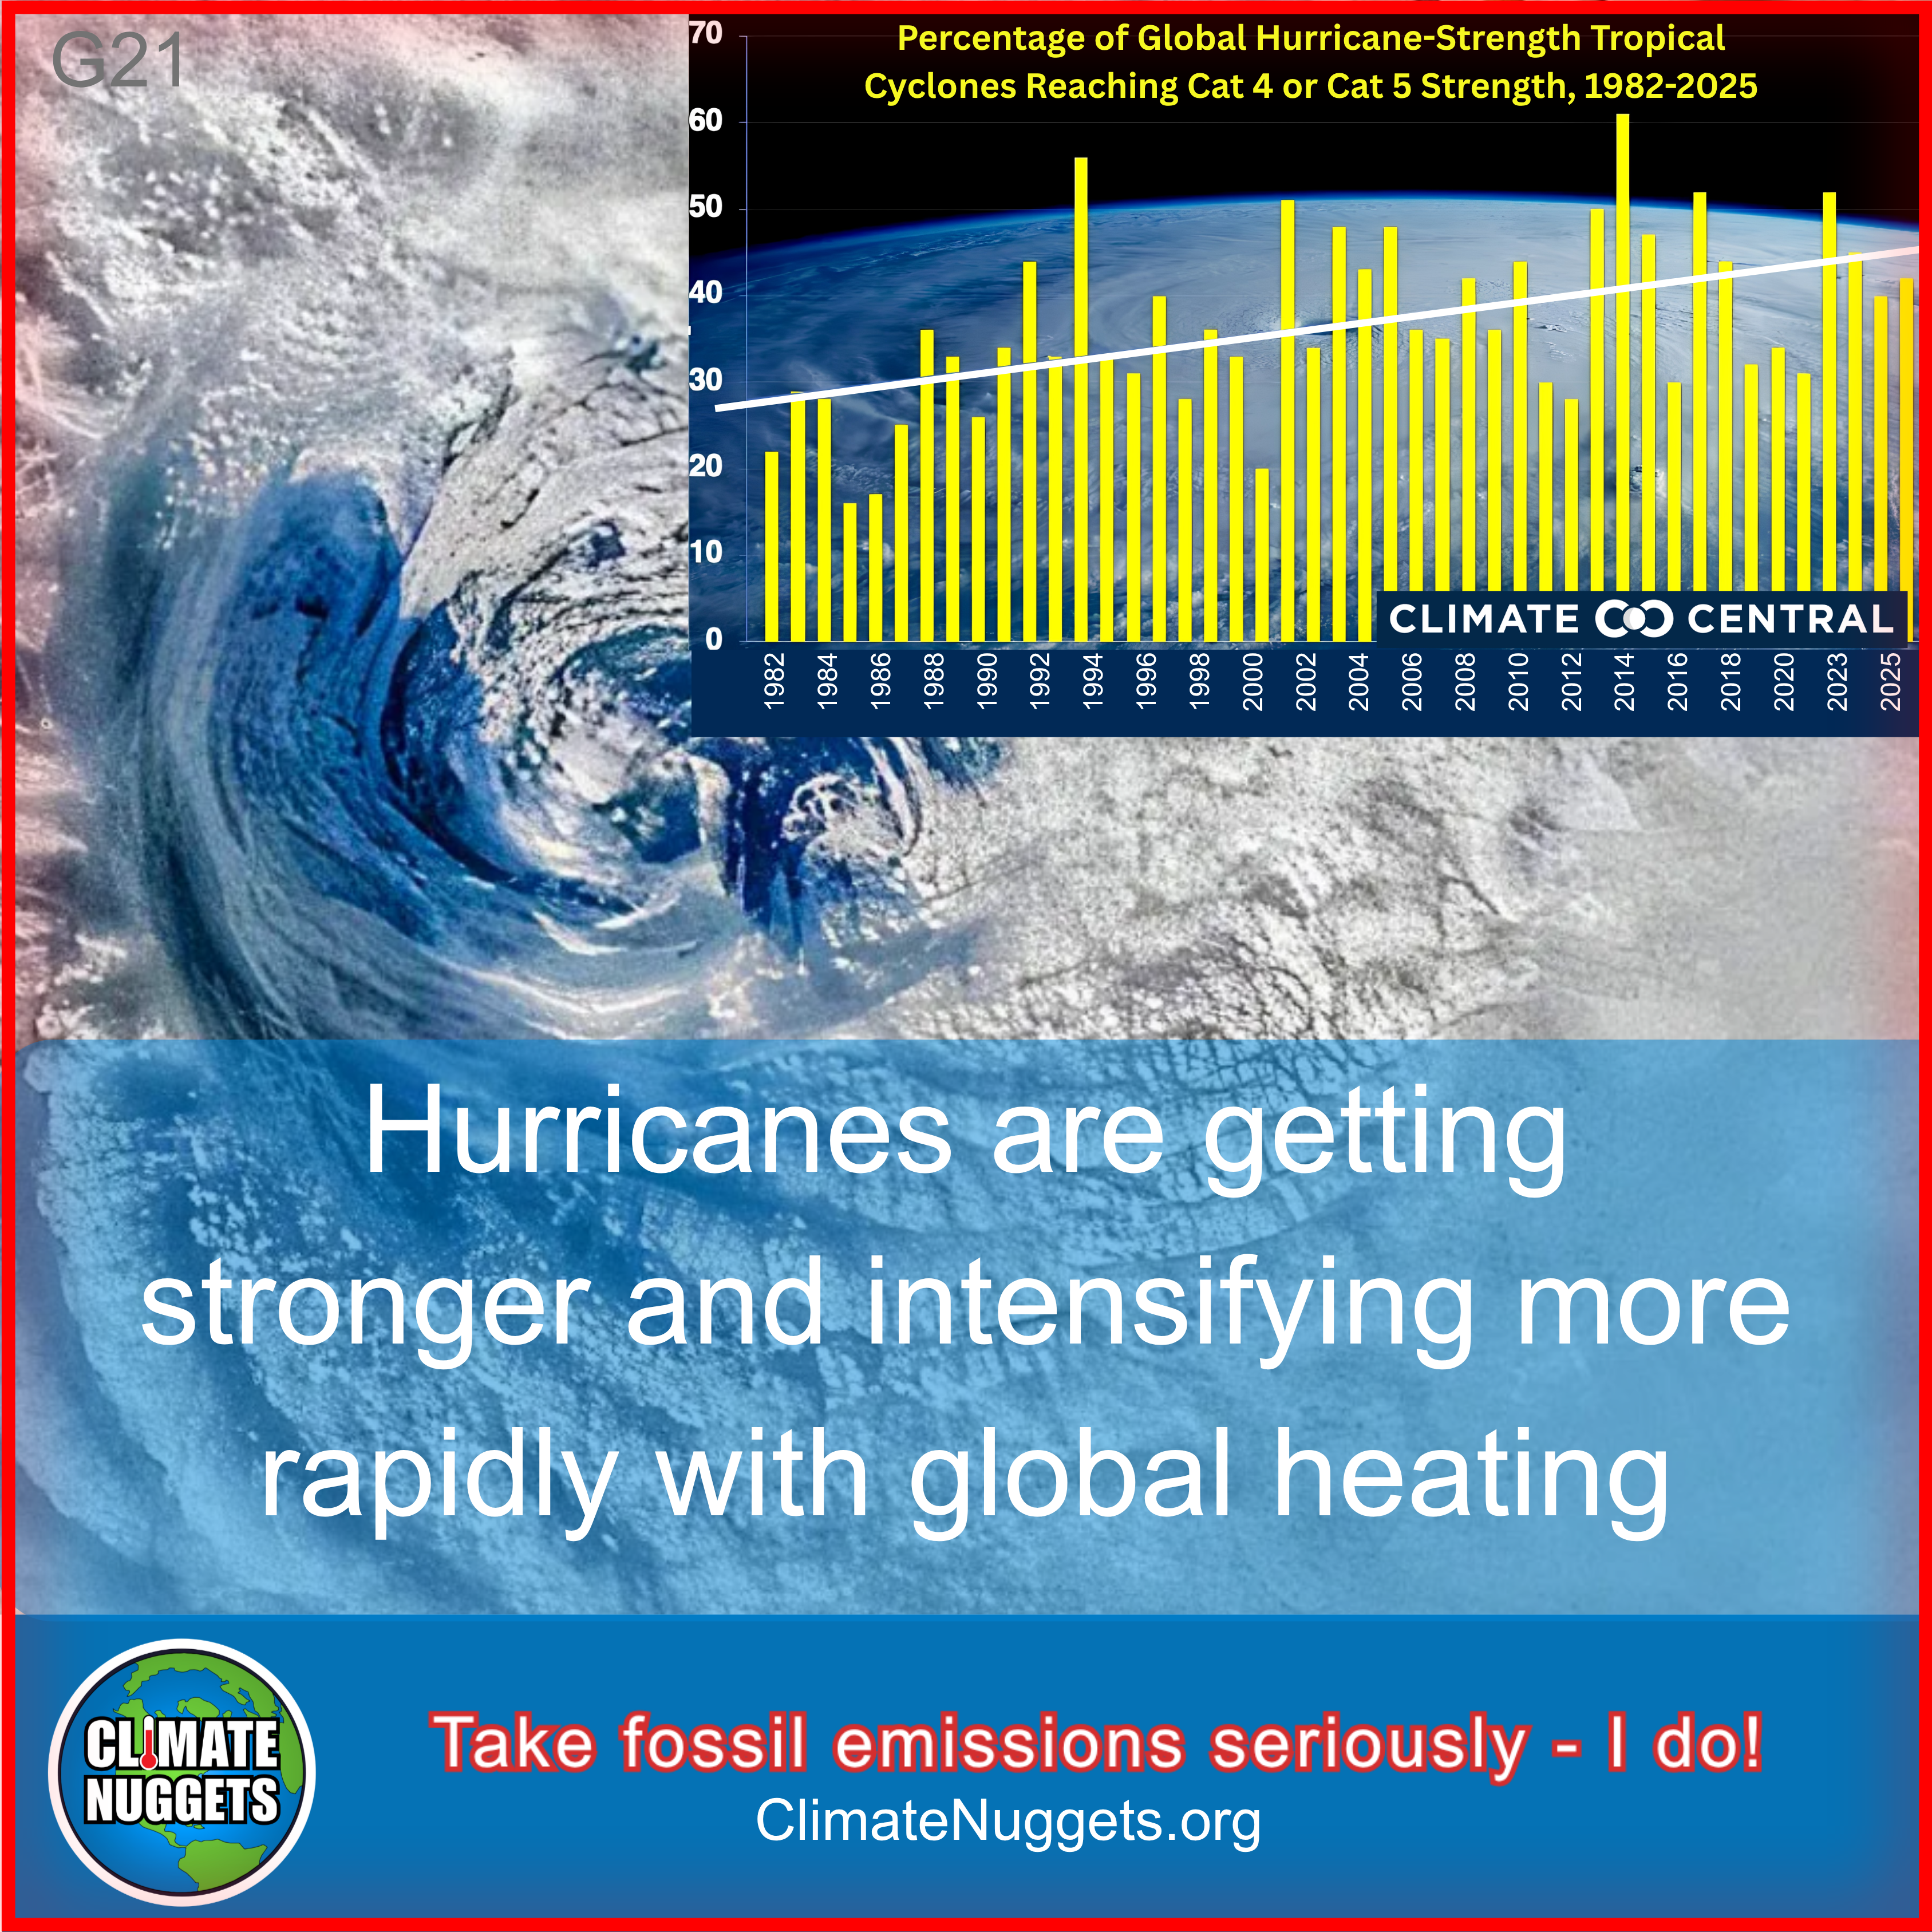
G21 — The Power of Hurricanes is Increasing with Global Heating
G21
G21.png

Hurricanes are hitting harder and faster because of global heating, to the point that adding a Category 6 is under discussion.  Disaster Preparedness is not just for this hurricane season!

Explore Resources for this Nugget:

Climate Central: Hurricane Rapid Intensification [Warming oceans are fueling stronger tropical cyclones — the most costly weather disasters in the U.S.  Most (70%) of the 63 total billion-dollar tropical cyclones in the U.S. since 1980 rapidly intensified.]


NIH: Global increase in major tropical cyclone exceedance probability over the past four decades [major tropical cyclones have increased about 25% in the last 40 years]


Nature: More tropical cyclones are striking coasts with major intensities at landfall  [annual global tropical cyclone landfalls with major landfall intensity has nearly doubled from 1982 to 2020 ]


Yale Climate Connections: Global warming is making the strongest hurricanes stronger [excellent discussion of numerous recent studies]


National Academy of Sciences: The growing inadequacy of an open-ended Saffir–Simpson hurricane wind scale in a warming world | PNAS [to communicate that climate change has caused the winds of the most intense TCs to become significantly higher. ]


NOAA: Global Warming and Hurricanes [Tropical cyclone rainfall rates are projected to increase Tropical cyclone intensities globally are projected to increase The global proportion of tropical cyclones that reach very intense (Category 4 and 5) levels is projected to increase .]

bottom of page